Saltar al contenido principal
LibreTexts Español

5: Estadística Descriptiva

  • Page ID
    151495
  • \( \newcommand{\vecs}[1]{\overset { \scriptstyle \rightharpoonup} {\mathbf{#1}} } \)

    \( \newcommand{\vecd}[1]{\overset{-\!-\!\rightharpoonup}{\vphantom{a}\smash {#1}}} \)

    \( \newcommand{\id}{\mathrm{id}}\) \( \newcommand{\Span}{\mathrm{span}}\)

    ( \newcommand{\kernel}{\mathrm{null}\,}\) \( \newcommand{\range}{\mathrm{range}\,}\)

    \( \newcommand{\RealPart}{\mathrm{Re}}\) \( \newcommand{\ImaginaryPart}{\mathrm{Im}}\)

    \( \newcommand{\Argument}{\mathrm{Arg}}\) \( \newcommand{\norm}[1]{\| #1 \|}\)

    \( \newcommand{\inner}[2]{\langle #1, #2 \rangle}\)

    \( \newcommand{\Span}{\mathrm{span}}\)

    \( \newcommand{\id}{\mathrm{id}}\)

    \( \newcommand{\Span}{\mathrm{span}}\)

    \( \newcommand{\kernel}{\mathrm{null}\,}\)

    \( \newcommand{\range}{\mathrm{range}\,}\)

    \( \newcommand{\RealPart}{\mathrm{Re}}\)

    \( \newcommand{\ImaginaryPart}{\mathrm{Im}}\)

    \( \newcommand{\Argument}{\mathrm{Arg}}\)

    \( \newcommand{\norm}[1]{\| #1 \|}\)

    \( \newcommand{\inner}[2]{\langle #1, #2 \rangle}\)

    \( \newcommand{\Span}{\mathrm{span}}\) \( \newcommand{\AA}{\unicode[.8,0]{x212B}}\)

    \( \newcommand{\vectorA}[1]{\vec{#1}}      % arrow\)

    \( \newcommand{\vectorAt}[1]{\vec{\text{#1}}}      % arrow\)

    \( \newcommand{\vectorB}[1]{\overset { \scriptstyle \rightharpoonup} {\mathbf{#1}} } \)

    \( \newcommand{\vectorC}[1]{\textbf{#1}} \)

    \( \newcommand{\vectorD}[1]{\overrightarrow{#1}} \)

    \( \newcommand{\vectorDt}[1]{\overrightarrow{\text{#1}}} \)

    \( \newcommand{\vectE}[1]{\overset{-\!-\!\rightharpoonup}{\vphantom{a}\smash{\mathbf {#1}}}} \)

    \( \newcommand{\vecs}[1]{\overset { \scriptstyle \rightharpoonup} {\mathbf{#1}} } \)

    \( \newcommand{\vecd}[1]{\overset{-\!-\!\rightharpoonup}{\vphantom{a}\smash {#1}}} \)

    \(\newcommand{\avec}{\mathbf a}\) \(\newcommand{\bvec}{\mathbf b}\) \(\newcommand{\cvec}{\mathbf c}\) \(\newcommand{\dvec}{\mathbf d}\) \(\newcommand{\dtil}{\widetilde{\mathbf d}}\) \(\newcommand{\evec}{\mathbf e}\) \(\newcommand{\fvec}{\mathbf f}\) \(\newcommand{\nvec}{\mathbf n}\) \(\newcommand{\pvec}{\mathbf p}\) \(\newcommand{\qvec}{\mathbf q}\) \(\newcommand{\svec}{\mathbf s}\) \(\newcommand{\tvec}{\mathbf t}\) \(\newcommand{\uvec}{\mathbf u}\) \(\newcommand{\vvec}{\mathbf v}\) \(\newcommand{\wvec}{\mathbf w}\) \(\newcommand{\xvec}{\mathbf x}\) \(\newcommand{\yvec}{\mathbf y}\) \(\newcommand{\zvec}{\mathbf z}\) \(\newcommand{\rvec}{\mathbf r}\) \(\newcommand{\mvec}{\mathbf m}\) \(\newcommand{\zerovec}{\mathbf 0}\) \(\newcommand{\onevec}{\mathbf 1}\) \(\newcommand{\real}{\mathbb R}\) \(\newcommand{\twovec}[2]{\left[\begin{array}{r}#1 \\ #2 \end{array}\right]}\) \(\newcommand{\ctwovec}[2]{\left[\begin{array}{c}#1 \\ #2 \end{array}\right]}\) \(\newcommand{\threevec}[3]{\left[\begin{array}{r}#1 \\ #2 \\ #3 \end{array}\right]}\) \(\newcommand{\cthreevec}[3]{\left[\begin{array}{c}#1 \\ #2 \\ #3 \end{array}\right]}\) \(\newcommand{\fourvec}[4]{\left[\begin{array}{r}#1 \\ #2 \\ #3 \\ #4 \end{array}\right]}\) \(\newcommand{\cfourvec}[4]{\left[\begin{array}{c}#1 \\ #2 \\ #3 \\ #4 \end{array}\right]}\) \(\newcommand{\fivevec}[5]{\left[\begin{array}{r}#1 \\ #2 \\ #3 \\ #4 \\ #5 \\ \end{array}\right]}\) \(\newcommand{\cfivevec}[5]{\left[\begin{array}{c}#1 \\ #2 \\ #3 \\ #4 \\ #5 \\ \end{array}\right]}\) \(\newcommand{\mattwo}[4]{\left[\begin{array}{rr}#1 \amp #2 \\ #3 \amp #4 \\ \end{array}\right]}\) \(\newcommand{\laspan}[1]{\text{Span}\{#1\}}\) \(\newcommand{\bcal}{\cal B}\) \(\newcommand{\ccal}{\cal C}\) \(\newcommand{\scal}{\cal S}\) \(\newcommand{\wcal}{\cal W}\) \(\newcommand{\ecal}{\cal E}\) \(\newcommand{\coords}[2]{\left\{#1\right\}_{#2}}\) \(\newcommand{\gray}[1]{\color{gray}{#1}}\) \(\newcommand{\lgray}[1]{\color{lightgray}{#1}}\) \(\newcommand{\rank}{\operatorname{rank}}\) \(\newcommand{\row}{\text{Row}}\) \(\newcommand{\col}{\text{Col}}\) \(\renewcommand{\row}{\text{Row}}\) \(\newcommand{\nul}{\text{Nul}}\) \(\newcommand{\var}{\text{Var}}\) \(\newcommand{\corr}{\text{corr}}\) \(\newcommand{\len}[1]{\left|#1\right|}\) \(\newcommand{\bbar}{\overline{\bvec}}\) \(\newcommand{\bhat}{\widehat{\bvec}}\) \(\newcommand{\bperp}{\bvec^\perp}\) \(\newcommand{\xhat}{\widehat{\xvec}}\) \(\newcommand{\vhat}{\widehat{\vvec}}\) \(\newcommand{\uhat}{\widehat{\uvec}}\) \(\newcommand{\what}{\widehat{\wvec}}\) \(\newcommand{\Sighat}{\widehat{\Sigma}}\) \(\newcommand{\lt}{<}\) \(\newcommand{\gt}{>}\) \(\newcommand{\amp}{&}\) \(\definecolor{fillinmathshade}{gray}{0.9}\)

    Cada vez que obtienes un nuevo conjunto de datos para mirar, una de las primeras tareas que tienes que hacer es encontrar formas de resumir los datos de una manera compacta y fácil de entender. De esto se trata la estadística descriptiva (a diferencia de las estadísticas inferenciales). De hecho, para muchas personas el término “estadística” es sinónimo de estadística descriptiva. Es este tema el que consideraremos en este capítulo, pero antes de entrar en detalles, tomemos un momento para tener una idea de por qué necesitamos estadísticas descriptivas. Para ello, carguemos el archivo AFLSmall.rData, y utilicemos la función who () en el paquete lsr para ver qué variables se almacenan en el archivo:

    load( "./data/aflsmall.Rdata" )
    library(lsr)
    ## Warning: package 'lsr' was built under R version 3.5.2
    who()
    ##    -- Name --      -- Class --   -- Size --
    ##    afl.finalists   factor        400       
    ##    afl.margins     numeric       176

    Aquí hay dos variables, afl.finalistas y afl.margins. Nos centraremos un poco en estas dos variables en este capítulo, así que será mejor que te diga cuáles son. A diferencia de la mayoría de los conjuntos de datos de este libro, estos son en realidad datos reales, relacionados con la Liga Australiana de Fútbol (AFL) 64 La variable afl.margins contiene el margen ganador (número de puntos) para todos los 176 partidos locales y fuera de casa jugados durante la temporada 2010. La variable afl.finalistas contiene los nombres de los 400 equipos que jugaron en los 200 partidos finales disputados durante el periodo 1987 a 2010. Echemos un vistazo a la variable afl.margins:

    print(afl.margins)
    ##   [1]  56  31  56   8  32  14  36  56  19   1   3 104  43  44  72   9  28
    ##  [18]  25  27  55  20  16  16   7  23  40  48  64  22  55  95  15  49  52
    ##  [35]  50  10  65  12  39  36   3  26  23  20  43 108  53  38   4   8   3
    ##  [52]  13  66  67  50  61  36  38  29   9  81   3  26  12  36  37  70   1
    ##  [69]  35  12  50  35   9  54  47   8  47   2  29  61  38  41  23  24   1
    ##  [86]   9  11  10  29  47  71  38  49  65  18   0  16   9  19  36  60  24
    ## [103]  25  44  55   3  57  83  84  35   4  35  26  22   2  14  19  30  19
    ## [120]  68  11  75  48  32  36  39  50  11   0  63  82  26   3  82  73  19
    ## [137]  33  48   8  10  53  20  71  75  76  54  44   5  22  94  29   8  98
    ## [154]   9  89   1 101   7  21  52  42  21 116   3  44  29  27  16   6  44
    ## [171]   3  28  38  29  10  10

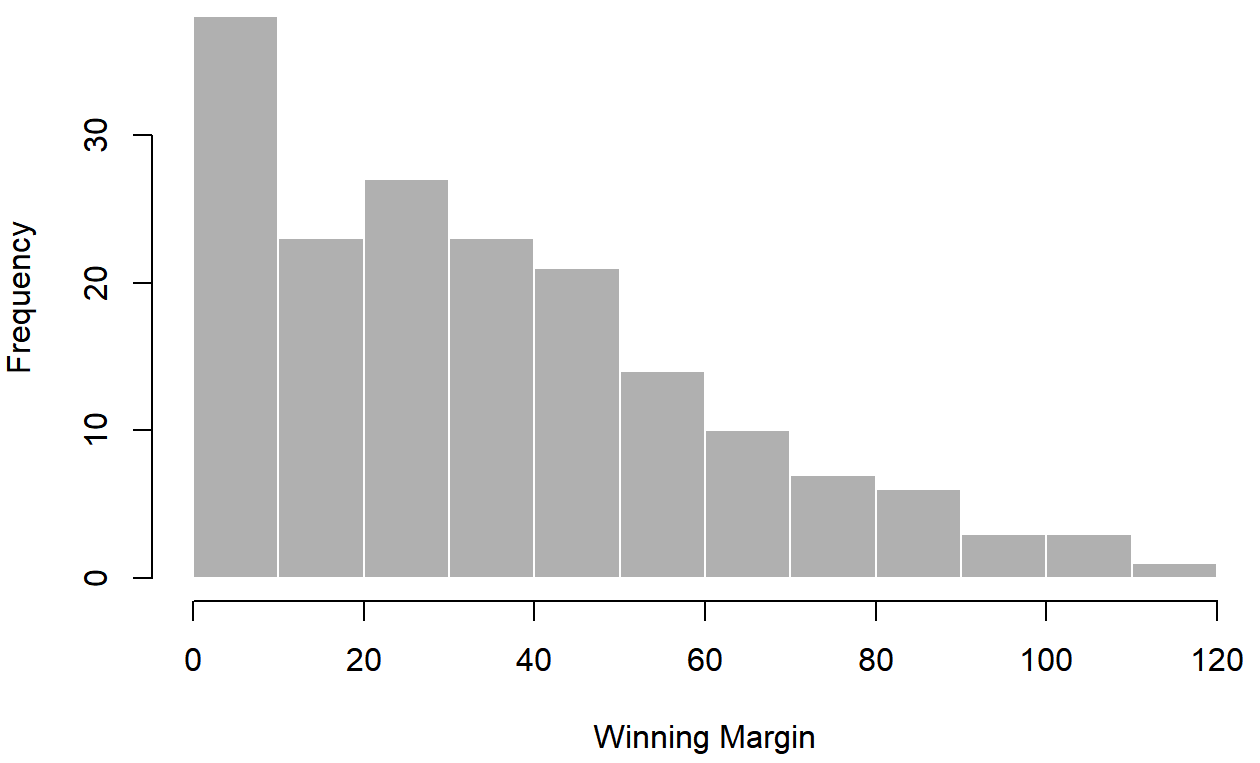
    Esta salida no hace que sea fácil tener una idea de lo que realmente dicen los datos. El simple hecho de “mirar los datos” no es una forma terriblemente efectiva de entender los datos. Para tener una idea de lo que está pasando, necesitamos calcular algunas estadísticas descriptivas (este capítulo) y dibujar algunas imágenes bonitas (Capítulo 6. Dado que las estadísticas descriptivas son lo más fácil de los dos temas, comenzaré con esos, pero sin embargo te mostraré un histograma de los datos afl.margins, ya que debería ayudarte a tener una idea de cómo se ven realmente los datos que estamos tratando de describir. Pero para lo que vale, este histograma —que se muestra en la Figura 5.1— se generó utilizando la función hist (). Hablaremos mucho más sobre cómo dibujar histogramas en la Sección 6.3. Por ahora, basta con mirar el histograma y señalar que proporciona una representación bastante interpretable de los datos afl.margins.
    histogram1-1.png
    Figura 5.1: Histograma de los datos del margen ganador de AFL 2010 (la variable afl.margins). Como cabría esperar, cuanto mayor sea el margen, con menos frecuencia tiende a verlo.


    This page titled 5: Estadística Descriptiva is shared under a CC BY-SA 4.0 license and was authored, remixed, and/or curated by Danielle Navarro via source content that was edited to the style and standards of the LibreTexts platform.