28.3: Trazado


- Última actualización
- 30 oct 2022
- Guardar como PDF

( \newcommand{\kernel}{\mathrm{null}\,}\)
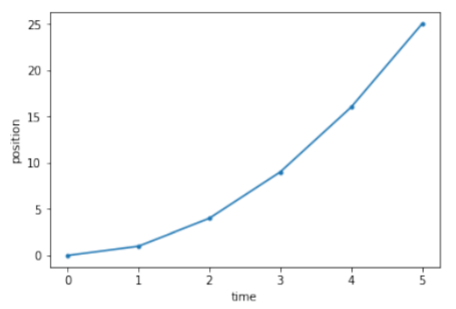
Varios módulos están disponibles en python para el trazado. Aquí mostraremos cómo usar el módulo pylab (que es equivalente al módulo matplotlib). Por ejemplo, podemos trazar fácilmente los datos en las dos matrices de la sección anterior para trazar la posición frente al tiempo para el objeto:
código python28.3.1
Trazado de dos matrices
01 | #import the pylab module |
02 | import pylab as pl |
03 |
04 | #define an array of values for the position of the object |
05 | position = [0 ,1 ,4 ,9 ,16 ,25] |
06 | #define an array of values for the corresponding times |
07 | time = [0 ,1 ,2 ,3 ,4 ,5] |
08 |
09 | #make the plot showing points and the line (.−) |
10 | pl.plot(time, position, '.-') |
11 | #add some labels: |
12 | pl.xlabel("time") #label for x-axis |
13 | pl.ylabel("position") #label for y-axis |
14 | #show the plot |
15 | pl.show() |
Salida
Ejercicio28.3.1
¿Cómo modificarías el código Python anterior para mostrar solo los puntos, y no la línea?
- Responder
-
Podemos usar Python para trazar cualquier función matemática que nos guste. Es importante darse cuenta de que las computadoras no tienen una representación de una función continua. Así, si quisiéramos trazar una función continua, primero necesitamos evaluar esa función en muchos puntos, y luego trazar esos puntos. El módulo numpy proporciona muchas características útiles para trabajar con matrices de números y aplicar funciones directamente a esas matrices.
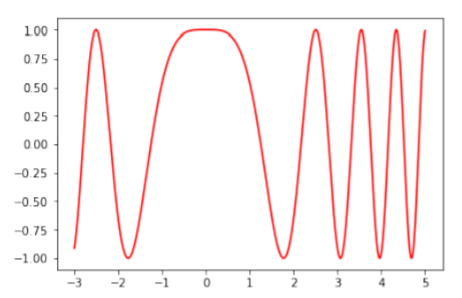
Supongamos que nos gustaría trazar la funciónf(x)=cos(x2) entrex=−3 yx=5. Para hacer esto en Python, primero generaremos una matriz de muchos valores dex entre−3 y5 usando el paquete numpy y la función linspace (min, max, N) que genera puntosN linealmente espaciados entre min y max . Luego evaluaremos la función en todos esos puntos para crear una segunda matriz. Finalmente, trazaremos las dos matrices una contra la otra:
código python28.3.2
Trazar una función de 1 variable
01 | #import the pylab and numpy modules |
02 | import pylab as pl |
03 | import numpy as np |
04 |
05 | #Use numpy to generate 1000 values of x between -3 and 5. |
06 | #xvals is an array with 1000 values in it: |
07 | xvals = np.linspace(-3,5,1000) |
08 |
09 | #Now, evaluate the function for all of those values of x. |
10 | #We use the numpy version of cos, since it allows us to take the cos |
11 | #of all values in the array. |
12 | #fvals will be an array with the 1000 corresponding cosines of the xvals squared |
13 | fvals = np.cos(xvals**2) |
14 |
15 | #make the plot showing only a line, and color it |
16 | pl.plot(xvals, fvals, color='red') |
17 | #show the plot |
18 | pl.show() |
Salida