
12.8: El catálisis
- Page ID
- 1900

\( \newcommand{\vecs}[1]{\overset { \scriptstyle \rightharpoonup} {\mathbf{#1}} } \)
\( \newcommand{\vecd}[1]{\overset{-\!-\!\rightharpoonup}{\vphantom{a}\smash {#1}}} \)
\( \newcommand{\dsum}{\displaystyle\sum\limits} \)
\( \newcommand{\dint}{\displaystyle\int\limits} \)
\( \newcommand{\dlim}{\displaystyle\lim\limits} \)
\( \newcommand{\id}{\mathrm{id}}\) \( \newcommand{\Span}{\mathrm{span}}\)
( \newcommand{\kernel}{\mathrm{null}\,}\) \( \newcommand{\range}{\mathrm{range}\,}\)
\( \newcommand{\RealPart}{\mathrm{Re}}\) \( \newcommand{\ImaginaryPart}{\mathrm{Im}}\)
\( \newcommand{\Argument}{\mathrm{Arg}}\) \( \newcommand{\norm}[1]{\| #1 \|}\)
\( \newcommand{\inner}[2]{\langle #1, #2 \rangle}\)
\( \newcommand{\Span}{\mathrm{span}}\)
\( \newcommand{\id}{\mathrm{id}}\)
\( \newcommand{\Span}{\mathrm{span}}\)
\( \newcommand{\kernel}{\mathrm{null}\,}\)
\( \newcommand{\range}{\mathrm{range}\,}\)
\( \newcommand{\RealPart}{\mathrm{Re}}\)
\( \newcommand{\ImaginaryPart}{\mathrm{Im}}\)
\( \newcommand{\Argument}{\mathrm{Arg}}\)
\( \newcommand{\norm}[1]{\| #1 \|}\)
\( \newcommand{\inner}[2]{\langle #1, #2 \rangle}\)
\( \newcommand{\Span}{\mathrm{span}}\) \( \newcommand{\AA}{\unicode[.8,0]{x212B}}\)
\( \newcommand{\vectorA}[1]{\vec{#1}} % arrow\)
\( \newcommand{\vectorAt}[1]{\vec{\text{#1}}} % arrow\)
\( \newcommand{\vectorB}[1]{\overset { \scriptstyle \rightharpoonup} {\mathbf{#1}} } \)
\( \newcommand{\vectorC}[1]{\textbf{#1}} \)
\( \newcommand{\vectorD}[1]{\overrightarrow{#1}} \)
\( \newcommand{\vectorDt}[1]{\overrightarrow{\text{#1}}} \)
\( \newcommand{\vectE}[1]{\overset{-\!-\!\rightharpoonup}{\vphantom{a}\smash{\mathbf {#1}}}} \)
\( \newcommand{\vecs}[1]{\overset { \scriptstyle \rightharpoonup} {\mathbf{#1}} } \)
\(\newcommand{\longvect}{\overrightarrow}\)
\( \newcommand{\vecd}[1]{\overset{-\!-\!\rightharpoonup}{\vphantom{a}\smash {#1}}} \)
\(\newcommand{\avec}{\mathbf a}\) \(\newcommand{\bvec}{\mathbf b}\) \(\newcommand{\cvec}{\mathbf c}\) \(\newcommand{\dvec}{\mathbf d}\) \(\newcommand{\dtil}{\widetilde{\mathbf d}}\) \(\newcommand{\evec}{\mathbf e}\) \(\newcommand{\fvec}{\mathbf f}\) \(\newcommand{\nvec}{\mathbf n}\) \(\newcommand{\pvec}{\mathbf p}\) \(\newcommand{\qvec}{\mathbf q}\) \(\newcommand{\svec}{\mathbf s}\) \(\newcommand{\tvec}{\mathbf t}\) \(\newcommand{\uvec}{\mathbf u}\) \(\newcommand{\vvec}{\mathbf v}\) \(\newcommand{\wvec}{\mathbf w}\) \(\newcommand{\xvec}{\mathbf x}\) \(\newcommand{\yvec}{\mathbf y}\) \(\newcommand{\zvec}{\mathbf z}\) \(\newcommand{\rvec}{\mathbf r}\) \(\newcommand{\mvec}{\mathbf m}\) \(\newcommand{\zerovec}{\mathbf 0}\) \(\newcommand{\onevec}{\mathbf 1}\) \(\newcommand{\real}{\mathbb R}\) \(\newcommand{\twovec}[2]{\left[\begin{array}{r}#1 \\ #2 \end{array}\right]}\) \(\newcommand{\ctwovec}[2]{\left[\begin{array}{c}#1 \\ #2 \end{array}\right]}\) \(\newcommand{\threevec}[3]{\left[\begin{array}{r}#1 \\ #2 \\ #3 \end{array}\right]}\) \(\newcommand{\cthreevec}[3]{\left[\begin{array}{c}#1 \\ #2 \\ #3 \end{array}\right]}\) \(\newcommand{\fourvec}[4]{\left[\begin{array}{r}#1 \\ #2 \\ #3 \\ #4 \end{array}\right]}\) \(\newcommand{\cfourvec}[4]{\left[\begin{array}{c}#1 \\ #2 \\ #3 \\ #4 \end{array}\right]}\) \(\newcommand{\fivevec}[5]{\left[\begin{array}{r}#1 \\ #2 \\ #3 \\ #4 \\ #5 \\ \end{array}\right]}\) \(\newcommand{\cfivevec}[5]{\left[\begin{array}{c}#1 \\ #2 \\ #3 \\ #4 \\ #5 \\ \end{array}\right]}\) \(\newcommand{\mattwo}[4]{\left[\begin{array}{rr}#1 \amp #2 \\ #3 \amp #4 \\ \end{array}\right]}\) \(\newcommand{\laspan}[1]{\text{Span}\{#1\}}\) \(\newcommand{\bcal}{\cal B}\) \(\newcommand{\ccal}{\cal C}\) \(\newcommand{\scal}{\cal S}\) \(\newcommand{\wcal}{\cal W}\) \(\newcommand{\ecal}{\cal E}\) \(\newcommand{\coords}[2]{\left\{#1\right\}_{#2}}\) \(\newcommand{\gray}[1]{\color{gray}{#1}}\) \(\newcommand{\lgray}[1]{\color{lightgray}{#1}}\) \(\newcommand{\rank}{\operatorname{rank}}\) \(\newcommand{\row}{\text{Row}}\) \(\newcommand{\col}{\text{Col}}\) \(\renewcommand{\row}{\text{Row}}\) \(\newcommand{\nul}{\text{Nul}}\) \(\newcommand{\var}{\text{Var}}\) \(\newcommand{\corr}{\text{corr}}\) \(\newcommand{\len}[1]{\left|#1\right|}\) \(\newcommand{\bbar}{\overline{\bvec}}\) \(\newcommand{\bhat}{\widehat{\bvec}}\) \(\newcommand{\bperp}{\bvec^\perp}\) \(\newcommand{\xhat}{\widehat{\xvec}}\) \(\newcommand{\vhat}{\widehat{\vvec}}\) \(\newcommand{\uhat}{\widehat{\uvec}}\) \(\newcommand{\what}{\widehat{\wvec}}\) \(\newcommand{\Sighat}{\widehat{\Sigma}}\) \(\newcommand{\lt}{<}\) \(\newcommand{\gt}{>}\) \(\newcommand{\amp}{&}\) \(\definecolor{fillinmathshade}{gray}{0.9}\)habilidades para desarrollar
- Explicar la función de un catalizador en términos de mecanismos de la reacción y diagramas de energía potencial.
- Listar ejemplos de catálisis en procesos naturales e industriales
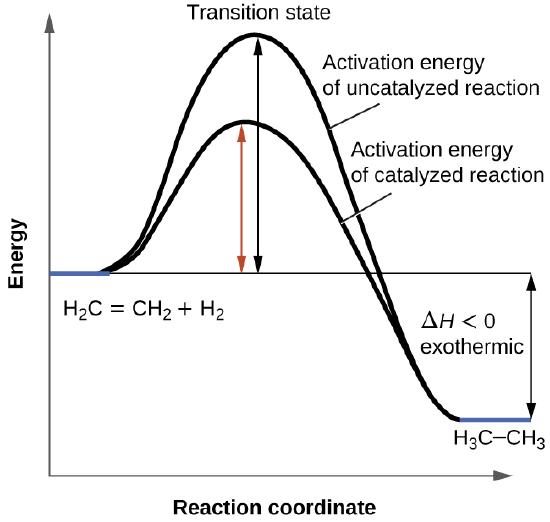
Hemos visto que la velocidad de muchas reacciones puede ser acelerada por los catalizadores. Un catalizador acelera la velocidad de una reacción al disminuir la energía de activación; Además, el catalizador se regenera en el proceso. Varias reacciones que son termodinámicamente favorables en ausencia de un catalizador solo ocurren a una velocidad razonable cuando hay un catalizador presente. Una de estas reacciones es la hidrogenación catalítica, el proceso por el cual se agrega hidrógeno a través de un enlace alqueno C = C para dar nos el producto alcano saturado. En la Figura \(\PageIndex{1}\) se muestra una comparación de los diagramas de coordenadas de reacción (también conocidos como los diagramas de energía) para la hidrogenación de alquenos catalizados y no catalizados.
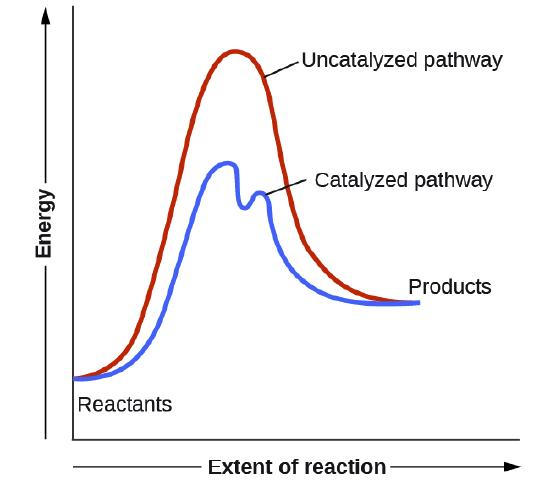
Los catalizadores funcionan al proporcionar un mecanismo de reacción alternativo que tiene una energía de activación menor que la que se encontraría en ausencia del catalizador. En algunos casos, el mecanismo catalizado puede incluir pasos adicionales, como se muestra en los diagramas de reacción que se muestran en la Figura \(\PageIndex{2}\). Esta energía de activación más baja resulta en un aumento en la velocidad como se describe en la ecuación de Arrhenius. Tenga en cuenta que un catalizador disminuye la energía de activación para las reacciones directas e inversas y, por lo tanto, acelera las reacciones directas e inversas. En consecuencia, la presencia de un catalizador permitirá que un sistema alcance el equilibrio más rápidamente, pero no tiene efecto en la posición del equilibrio como se refleja en el valor de su constante de equilibrio (vea el capítulo posterior sobre el equilibrio químico).
Ejemplo \(\PageIndex{1}\): USANDO LOS DIAGRAMAS DE REACCIÓN PARA COMPARAR REACCIONES CATALIZADAS
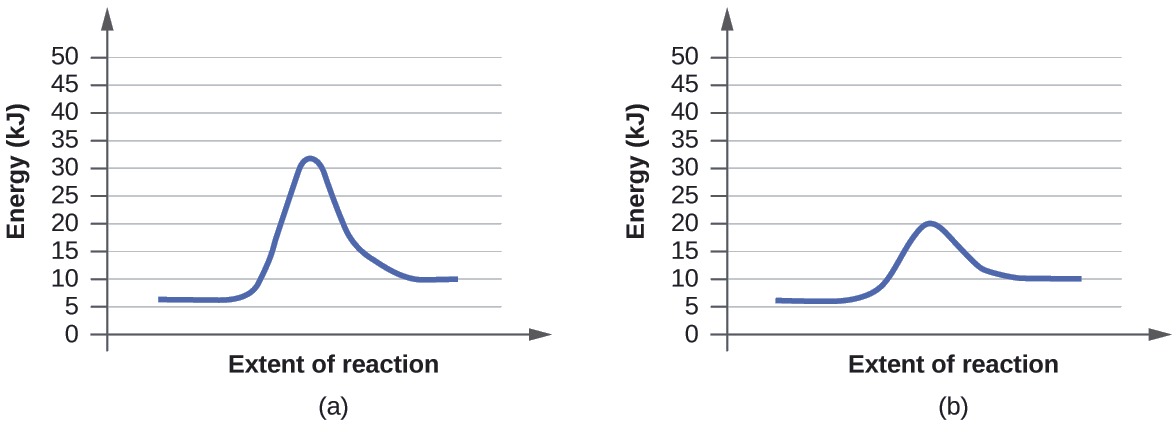
Los dos diagramas de la reacción aquí representan la misma reacción: una reacción sin catalizador y otra reacción con catalizador. Identifique cuál de los diagramas sugieren la presencia de un catalizador y determine la energía de activación para la reacción catalizada.
Solución
Un catalizador no afecta la energía del reactivo o del producto, por lo que esos aspectos de los diagramas se pueden ignorar; son como esperaríamos, idénticos a ese respecto. Sin embargo, hay una diferencia notable en el estado de transición, que es claramente inferior en el diagrama (b) que en (a). Esto indica el uso de un catalizador en el diagrama (b). La energía de activación es la diferencia entre la energía de los reactivos de partida y el estado de transición, un máximo en el diagrama de coordenadas de reacción. Los reactivos están a 6 kJ y el estado de transición está a 20 kJ, por lo que la energía de activación se puede calcular de la siguiente manera:
\[E_\ce{a}=\mathrm{20\:kJ−6\:kJ=14\:kJ} \label{12.8.1}\]
Ejercicio \(\PageIndex{1}\)
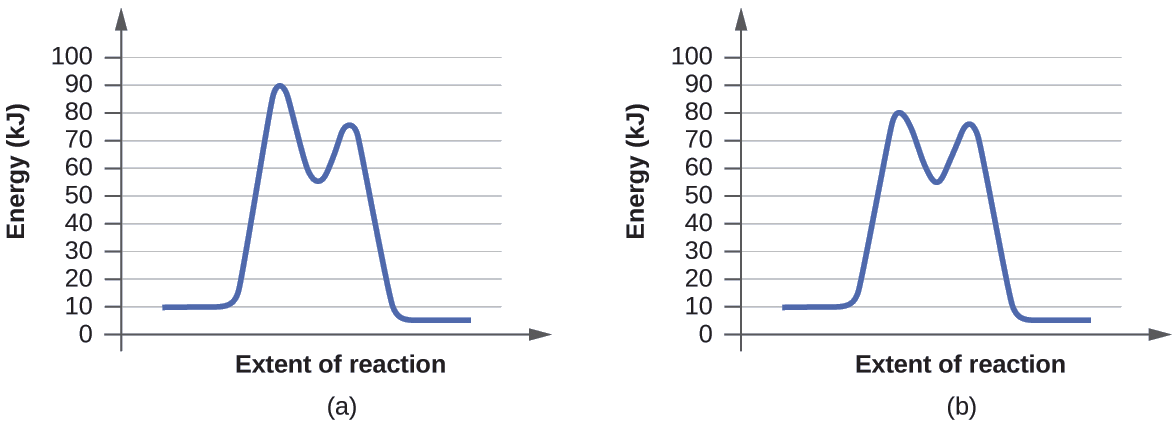
Determine cuál de los dos diagramas aquí (ambos para la misma reacción) involucra un catalizador e identifique la energía de activación para la reacción catalizada:
- Respuesta
-
El diagrama (b) es una reacción catalizada con una energía de activación de aproximadamente 70 kJ.
Catalizadores Homogéneos
Un catalizador homogéneo está presente en la misma fase que los reactivos. Interactúa con un reactivo para formar una sustancia intermedia, que luego se descompone o reacciona con otro reactivo en uno o más pasos para regenerar el catalizador original y formar el producto. Como una ilustración importante de la catálisis homogénea, considere la capa de ozono de la tierra. El ozono en la atmósfera superior, que protege la tierra de la radiación ultravioleta, se forma cuando las moléculas de oxígeno absorben la luz ultravioleta y reaccionan:
El ozono es una molécula relativamente inestable que se descompone para producir el oxígeno diatómico por el reverso de esta ecuación. Esta reacción de descomposición es consistente con el siguiente mecanismo:
O + O3 ⟶ 2O2} \label{12.8.3}\]
La presencia del óxido nítrico, NO, influye la velocidad de descomposición del ozono. El óxido nítrico actúa como un catalizador en el siguiente mecanismo:
\[\ce{NO}(g)+\ce{O3}(g)⟶\ce{NO2}(g)+\ce{O2}(g)\\
\ce{O3}(g)⟶\ce{O2}(g)+\ce{O}(g)\\
\ce{NO2}(g)+\ce{O}(g)⟶\ce{NO}(g)+\ce{O2}(g) \label{12.8.4}\]
El cambio químico general para el mecanismo catalizado es el mismo que:
El óxido nítrico reacciona y se regenera en estas reacciones. No se usa permanentemente; por lo tanto, actúa como un catalizador. La velocidad de la descomposición del ozono es más rápida en la presencia del óxido nítrico debido a la actividad catalítica del NO. Ciertos compuestos que contienen cloro también catalizan la descomposición del ozono.
Mario J. Molina
El Premio Nobel de Química de 1995 fue compartido por Paul J. Crutzen, Mario J. Molina (Figura \(\PageIndex{3}\)) y F. Sherwood Rowland "por su trabajo en la química atmosférica, particularmente en respecto a la formación y descomposición del ozono ." Molina, ciudadano mexicano, hizo la mayoría de su trabajo en el Instituto Tecnológico de Massachusetts (MIT).
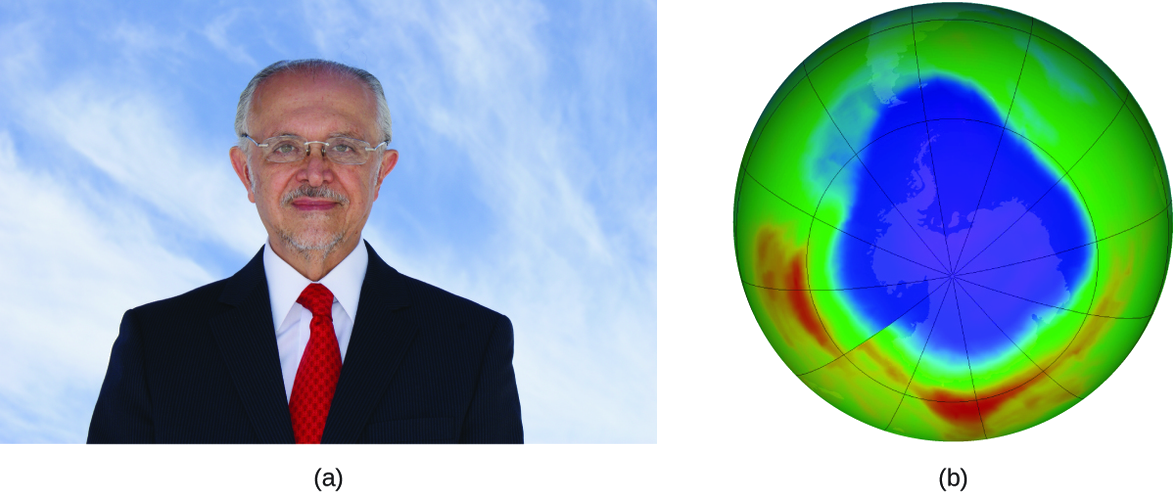
En 1974, Molina y Rowland publicaron un artículo en la revista de Nature (una de las principales publicaciones revisadas en el campo de la ciencia) que detalla la amenaza de los gases de clorofluorocarbono para la estabilidad de la capa de ozono en la atmósfera superior de la Tierra. La capa de ozono protege la tierra de la radiación solar al absorber la luz ultravioleta. A medida que las reacciones químicas agotan la cantidad de ozono en la atmósfera superior, se forma un "agujero" medible sobre la Antártida, y un aumento en la cantidad de radiación ultravioleta solar, fuertemente relacionada con la prevalencia de cánceres de piel, llega a la superficie de la Tierra. El trabajo de Molina y Rowland fue instrumental en la adopción del Protocolo de Montreal, un tratado internacional firmado en 1987 que comenzó a eliminar con éxito la producción de los productos químicos relacionados con la destrucción del ozono.
Molina y Rowland demostraron que los átomos de cloro de los químicos producidos por el hombre pueden catalizar la destrucción del ozono en un proceso similar al cual NO acelera el agotamiento del ozono. Los átomos de cloro se generan cuando los clorocarbonos o los clorofluorocarbonos, una vez ampliamente usados como refrigerantes y propulsores, se descomponen fotoquímicamente por la luz ultravioleta o reaccionan con los radicales hidroxilos. Aquí se muestra un mecanismo de muestra usando el cloruro de metilo:
Los radicales de cloro descomponen el ozono y se regeneran mediante el siguiente ciclo catalítico:
\ce{ClO + O ⟶ Cl + O2}\\
\textrm{overall Reaction: }\ce{O3 + O ⟶ 2O2}\]
Un solo cloro monoatómico se puede descomponer en miles de moléculas de ozono. Afortunadamente, la mayoría del cloro atmosférico existe como formas catalíticamente inactivas de Cl2 y ClONO2.
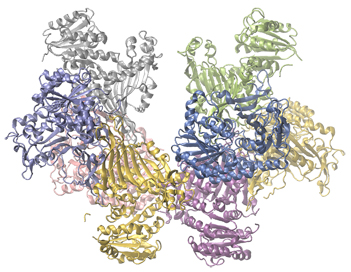
Deficiencia de glucosa-6-fosfato deshidrogenasa
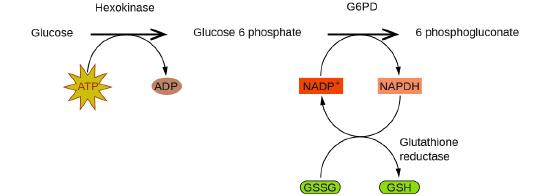
Las enzimas en el cuerpo humano actúan como catalizadores de importantes reacciones químicas. Deficiencia de glucosa-6-fosfato deshidrogenasain metabolismo celular. Como tal, una deficiencia de una enzima particular puede resultar en una enfermedad que potencialmente puede causar la muerte. La deficiencia de G6PD (glucosa-6-fosfato deshidrogenasa), es una condición genética que resulta en una escasez de la enzima glucosa-6-fosfato deshidrogenasa y es la deficiencia enzimática más común en humanos. Esta enzima, que se muestra en la Figura \(\PageIndex{4}\), es la enzima limitante de la velocidad de la ruta metabólica que suministra NADPH a las células (Figura \(\PageIndex{5}\)).
Una interrupción en esta reacción metabólica puede causar una reducción del glutatión en los glóbulos rojos; una vez que se consume todo el glutatión, las enzimas y otras proteínas, como la hemoglobina, son susceptibles al daño. Por ejemplo, la hemoglobina se puede metabolizar y formar la bilirrubina, lo que conduce a ictericia, una afección que se puede volver grave. Las personas que sufren de la deficiencia de G6PD deben evitar ciertos alimentos y medicamentos que contienen productos químicos que pueden provocar daños en sus glóbulos rojos deficientes en glutatión.
Los catalizadores heterogéneos
Un catalizador heterogéneo es un catalizador que está presente en una fase diferente (generalmente un sólido) que los reactivos. Tales catalizadores generalmente funcionan al proporcionar una superficie activa sobre la cual puede ocurrir una reacción. Las reacciones en la fase gaseosa y líquida catalizadas por los catalizadores heterogéneos ocurren en la superficie del catalizador en lugar de dentro de la fase gaseosa o líquida.
La catálisis heterogénea tiene al menos cuatro pasos:
- Adsorción del reactivo sobre la superficie del catalizador.
- Activación del reactivo adsorbido.
- Reacción del reactivo adsorbido
- Difusión del producto desde la superficie hacia la fase gaseosa o líquida (desorción).
Cualquiera de estos pasos puede ser lento y, por lo tanto, puede servir como el paso determinante de la velocidad. Sin embargo, en general, en presencia del catalizador, la velocidad general de la reacción es más rápida de lo que sería si los reactivos estuvieran en la fase gaseosa o líquida.
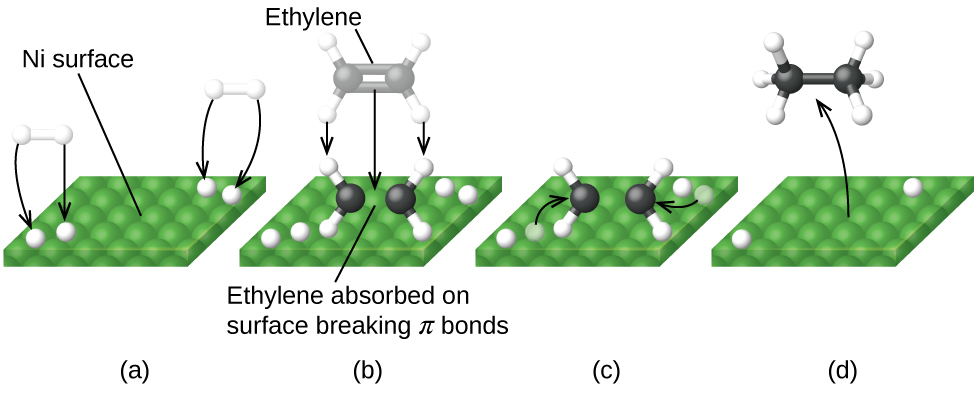
La Figura \(\PageIndex{6}\) ilustra los pasos que los químicos creen que ocurren en la reacción de los compuestos que contienen un doble enlace carbono-carbono con hidrógeno en un catalizador de níquel. El níquel es el catalizador que se usa en la hidrogenación de grasas y aceites poliinsaturados (que contienen varios enlaces dobles carbono-carbono) para producir grasas y aceites saturados (que contienen solo enlaces simples carbono-carbono).
Otros importantes procesos industriales que involucran el uso de los catalizadores heterogéneos incluyen la preparación del ácido sulfúrico, la preparación del amoníaco, la oxidación del amoníaco al ácido nítrico y la síntesis del metanol, CH3OH. Los catalizadores heterogéneos también se usan en los convertidores catalíticos que se encuentran en la mayoría de los automóviles que funcionan con la gasolina (Figura \(\PageIndex{7}\)).
CONVERTIDORES CATALÍTICOS DE los automóviles
Los científicos desarrollaron los convertidores catalíticos para reducir la cantidad de emisiones tóxicas producidas al quemar gasolina en los motores de combustión interna. Los convertidores catalíticos aprovechan los cinco factores que afectan la velocidad de las reacciones químicas para garantizar que las emisiones de escape sean lo más seguras posible.
Al usar una mezcla cuidadosamente seleccionada de metales catalíticamente activos, es posible llevar a cabo la combustión completa de todos los compuestos que contienen carbono en dióxido de carbono al tiempo que se reduce la producción de los óxidos de nitrógeno. Esto es particularmente impresionante cuando consideramos que un paso involucra la adición de más oxígeno a la molécula y el otro involucra eliminar el oxígeno (Figura \(\PageIndex{6}\)).
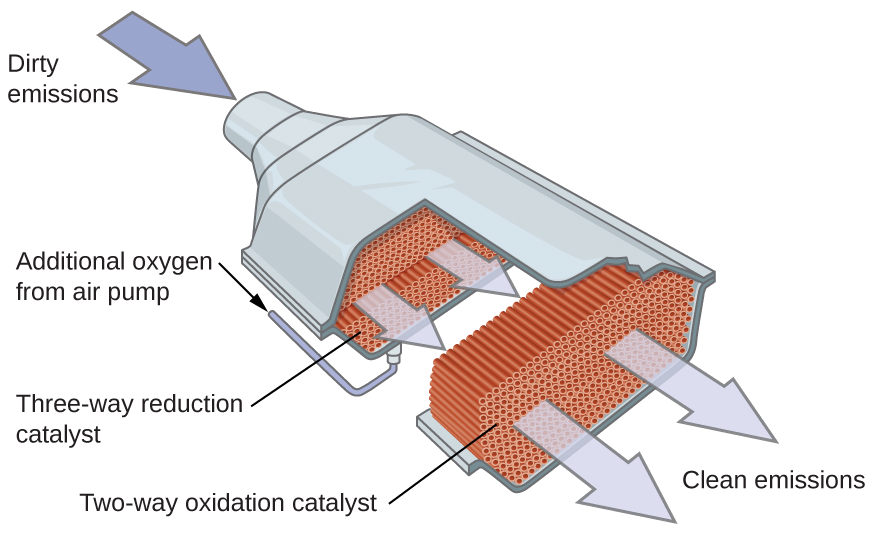
Los convertidores catalíticos más modernos de tres vías poseen una superficie impregnada con un catalizador de platino-rodio, que cataliza la conversión del óxido nítrico al dinitrógeno y oxígeno, así como la conversión del monóxido de carbono e hidrocarburos como el octano en dióxido de carbono y vapor de agua:
\[\ce{2NO2}(g)⟶\ce{N2}(g)+\ce{2O2}(g)\\ [5pt]
\ce{2CO}(g)+\ce{O2}(g)⟶\ce{2CO2}(g)\\ [5pt]
\ce{2C8H18}(g)+\ce{25O2}(g)⟶\ce{16CO2}(g)+\ce{18H2O}(g)\]
Para ser lo más eficiente posible, la mayoría de los convertidores catalíticos son precalentados por un calentador eléctrico. Esto asegura que los metales en el catalizador estén completamente activos incluso antes de que el escape del automóvil esté lo suficientemente caliente como para mantener las temperaturas de reacción apropiadas.
Estructura y función de las enzimas
El estudio de las enzimas es una interconexión importante entre la biología y la química. Las enzimas son generalmente proteínas (polipéptidos) que ayudan a controlar la velocidad de las reacciones químicas entre los compuestos biológicamente importantes, particularmente aquellos que están involucrados en el metabolismo celular. Las diferentes clases de enzimas realizan una variedad de funciones, como se muestra en la Tabla \(\PageIndex{1}\).
| Clase | Función |
|---|---|
| oxidorreductasas | reacciones redox |
| transferasas | transferencia de grupos funcionales |
| hidrolasas | reacciones de hidrólisis |
| liasa | eliminación grupal para formar dobles enlaces |
| isomerasas | isomerización |
| ligases | formación de enlaces con hidrólisis de ATP |
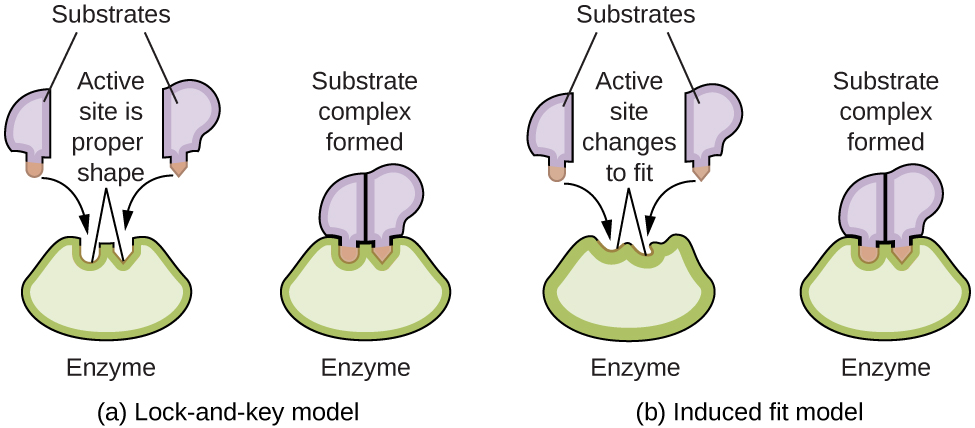
Las moléculas de las enzimas poseen un sitio activo, una parte de la molécula con una forma que le permite unirse a un sustrato específico (una molécula reactiva), formando un complejo enzima-sustrato como un intermedio de la reacción. Hay dos modelos que intentan explicar cómo funciona este sitio activo. El modelo más simplista se conoce como la hipótesis de la cerradura y la llave, lo que sugiere que las formas moleculares del sitio activo y el sustrato son complementarias, encajando juntas como una llave en una cerradura. La hipótesis de ajuste inducido, por otro lado, sugiere que la molécula enzimática es flexible y cambia de forma para acomodar un enlace con el sustrato. Sin embargo, esto no sugiere que el sitio activo de una enzima sea completamente maleable. Tanto el modelo de cerradura y llave como el modelo de ajuste inducido explican el hecho de que las enzimas solo se pueden unir con sustratos específicos, ya que en general una enzima particular solo cataliza una reacción particular (Figura \(\PageIndex{7}\)).
Resumen
Los catalizadores afectan la velocidad de una reacción química al alterar su mecanismo para proporcionar una energía de activación más baja. Los catalizadores pueden ser homogéneos (en la misma fase que los reactivos) o heterogéneos (una fase diferente a los reactivos)
Notas al pie de la página
- "El Premio Nobel de Química 1995", Premio Nobel.org, consultado el 18 de febrero de 2015, http://www.nobelprize.org/nobel_priz...aureates/1995/.
Glosario
- catalizador heterogéneo
- catalizador presente en una fase diferente de los reactivos, proporcionando una superficie en la que puede ocurrir una reacción
- catalizador homogéneo
- catalizador presente en la misma fase que los reactivos
Contribuyentes
Paul Flowers (Universidad de Carolina del Norte - Pembroke), Klaus Theopold (Universidad de Delaware) y Richard Langley (Stephen F. Austin Universidad del Estado) con autores contribuyentes. Contenido del libro de texto producido por la Universidad de OpenStax tiene licencia de Atribución de Creative Commons Licencia 4.0 licencia. Descarge gratis en http://cnx.org/contents/85abf193-2bd...a7ac8df6@9.110)."
Ana Martinez (amartinez02@saintmarys.edu) contribuyó a la traducción de este texto.