26.4: A.4- Graficar una función definida por partes
- Page ID
- 117813
\( \newcommand{\vecs}[1]{\overset { \scriptstyle \rightharpoonup} {\mathbf{#1}} } \)
\( \newcommand{\vecd}[1]{\overset{-\!-\!\rightharpoonup}{\vphantom{a}\smash {#1}}} \)
\( \newcommand{\id}{\mathrm{id}}\) \( \newcommand{\Span}{\mathrm{span}}\)
( \newcommand{\kernel}{\mathrm{null}\,}\) \( \newcommand{\range}{\mathrm{range}\,}\)
\( \newcommand{\RealPart}{\mathrm{Re}}\) \( \newcommand{\ImaginaryPart}{\mathrm{Im}}\)
\( \newcommand{\Argument}{\mathrm{Arg}}\) \( \newcommand{\norm}[1]{\| #1 \|}\)
\( \newcommand{\inner}[2]{\langle #1, #2 \rangle}\)
\( \newcommand{\Span}{\mathrm{span}}\)
\( \newcommand{\id}{\mathrm{id}}\)
\( \newcommand{\Span}{\mathrm{span}}\)
\( \newcommand{\kernel}{\mathrm{null}\,}\)
\( \newcommand{\range}{\mathrm{range}\,}\)
\( \newcommand{\RealPart}{\mathrm{Re}}\)
\( \newcommand{\ImaginaryPart}{\mathrm{Im}}\)
\( \newcommand{\Argument}{\mathrm{Arg}}\)
\( \newcommand{\norm}[1]{\| #1 \|}\)
\( \newcommand{\inner}[2]{\langle #1, #2 \rangle}\)
\( \newcommand{\Span}{\mathrm{span}}\) \( \newcommand{\AA}{\unicode[.8,0]{x212B}}\)
\( \newcommand{\vectorA}[1]{\vec{#1}} % arrow\)
\( \newcommand{\vectorAt}[1]{\vec{\text{#1}}} % arrow\)
\( \newcommand{\vectorB}[1]{\overset { \scriptstyle \rightharpoonup} {\mathbf{#1}} } \)
\( \newcommand{\vectorC}[1]{\textbf{#1}} \)
\( \newcommand{\vectorD}[1]{\overrightarrow{#1}} \)
\( \newcommand{\vectorDt}[1]{\overrightarrow{\text{#1}}} \)
\( \newcommand{\vectE}[1]{\overset{-\!-\!\rightharpoonup}{\vphantom{a}\smash{\mathbf {#1}}}} \)
\( \newcommand{\vecs}[1]{\overset { \scriptstyle \rightharpoonup} {\mathbf{#1}} } \)
\( \newcommand{\vecd}[1]{\overset{-\!-\!\rightharpoonup}{\vphantom{a}\smash {#1}}} \)
\(\newcommand{\avec}{\mathbf a}\) \(\newcommand{\bvec}{\mathbf b}\) \(\newcommand{\cvec}{\mathbf c}\) \(\newcommand{\dvec}{\mathbf d}\) \(\newcommand{\dtil}{\widetilde{\mathbf d}}\) \(\newcommand{\evec}{\mathbf e}\) \(\newcommand{\fvec}{\mathbf f}\) \(\newcommand{\nvec}{\mathbf n}\) \(\newcommand{\pvec}{\mathbf p}\) \(\newcommand{\qvec}{\mathbf q}\) \(\newcommand{\svec}{\mathbf s}\) \(\newcommand{\tvec}{\mathbf t}\) \(\newcommand{\uvec}{\mathbf u}\) \(\newcommand{\vvec}{\mathbf v}\) \(\newcommand{\wvec}{\mathbf w}\) \(\newcommand{\xvec}{\mathbf x}\) \(\newcommand{\yvec}{\mathbf y}\) \(\newcommand{\zvec}{\mathbf z}\) \(\newcommand{\rvec}{\mathbf r}\) \(\newcommand{\mvec}{\mathbf m}\) \(\newcommand{\zerovec}{\mathbf 0}\) \(\newcommand{\onevec}{\mathbf 1}\) \(\newcommand{\real}{\mathbb R}\) \(\newcommand{\twovec}[2]{\left[\begin{array}{r}#1 \\ #2 \end{array}\right]}\) \(\newcommand{\ctwovec}[2]{\left[\begin{array}{c}#1 \\ #2 \end{array}\right]}\) \(\newcommand{\threevec}[3]{\left[\begin{array}{r}#1 \\ #2 \\ #3 \end{array}\right]}\) \(\newcommand{\cthreevec}[3]{\left[\begin{array}{c}#1 \\ #2 \\ #3 \end{array}\right]}\) \(\newcommand{\fourvec}[4]{\left[\begin{array}{r}#1 \\ #2 \\ #3 \\ #4 \end{array}\right]}\) \(\newcommand{\cfourvec}[4]{\left[\begin{array}{c}#1 \\ #2 \\ #3 \\ #4 \end{array}\right]}\) \(\newcommand{\fivevec}[5]{\left[\begin{array}{r}#1 \\ #2 \\ #3 \\ #4 \\ #5 \\ \end{array}\right]}\) \(\newcommand{\cfivevec}[5]{\left[\begin{array}{c}#1 \\ #2 \\ #3 \\ #4 \\ #5 \\ \end{array}\right]}\) \(\newcommand{\mattwo}[4]{\left[\begin{array}{rr}#1 \amp #2 \\ #3 \amp #4 \\ \end{array}\right]}\) \(\newcommand{\laspan}[1]{\text{Span}\{#1\}}\) \(\newcommand{\bcal}{\cal B}\) \(\newcommand{\ccal}{\cal C}\) \(\newcommand{\scal}{\cal S}\) \(\newcommand{\wcal}{\cal W}\) \(\newcommand{\ecal}{\cal E}\) \(\newcommand{\coords}[2]{\left\{#1\right\}_{#2}}\) \(\newcommand{\gray}[1]{\color{gray}{#1}}\) \(\newcommand{\lgray}[1]{\color{lightgray}{#1}}\) \(\newcommand{\rank}{\operatorname{rank}}\) \(\newcommand{\row}{\text{Row}}\) \(\newcommand{\col}{\text{Col}}\) \(\renewcommand{\row}{\text{Row}}\) \(\newcommand{\nul}{\text{Nul}}\) \(\newcommand{\var}{\text{Var}}\) \(\newcommand{\corr}{\text{corr}}\) \(\newcommand{\len}[1]{\left|#1\right|}\) \(\newcommand{\bbar}{\overline{\bvec}}\) \(\newcommand{\bhat}{\widehat{\bvec}}\) \(\newcommand{\bperp}{\bvec^\perp}\) \(\newcommand{\xhat}{\widehat{\xvec}}\) \(\newcommand{\vhat}{\widehat{\vvec}}\) \(\newcommand{\uhat}{\widehat{\uvec}}\) \(\newcommand{\what}{\widehat{\wvec}}\) \(\newcommand{\Sighat}{\widehat{\Sigma}}\) \(\newcommand{\lt}{<}\) \(\newcommand{\gt}{>}\) \(\newcommand{\amp}{&}\) \(\definecolor{fillinmathshade}{gray}{0.9}\)Supongamos que desea graficar la función definida por partes
\[f(x)= \begin{cases}x^{2}, & x<2 \\ 2 x-7, & x \geq 2\end{cases} \nonumber \]
Ir al menú. Necesitamos ingresar a la función de la siguiente manera:
\[y=x^2(x<2)+(2x-7)(x\geq 2) \nonumber \]
Las únicas entradas nuevas están en los signos de desigualdad, a los que se puede acceder a través del menú “TEST” (\(\boxed{\text{2nd}}\)\(\boxed{\text{math}}\)).
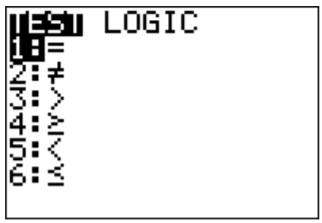
Por lo tanto, presionamos las teclas:\(\boxed{\text{X,T,}\theta,n}\)\(\boxed{x^2}\)\(\boxed{\text{(}}\)\(\boxed{\text{X,T,}\theta,n}\)\(\boxed{\text{2nd}}\)\(\boxed{\text{math}}\)\(\boxed{\text{5}}\)\(\boxed{\text{2}}\)\(\boxed{\text{)}}\)\(\boxed{\text{+}}\)\(\boxed{\text{(}}\)\(\boxed{\text{2}}\)\(\boxed{\text{X,T,}\theta,n}\)\(\boxed{\text{-}}\)\(\boxed{\text{7}}\)\(\boxed{\text{)}}\)\(\boxed{\text{(}}\)\(\boxed{\text{X,T,}\theta,n}\)\(\boxed{\text{2nd}}\)\(\boxed{\text{math}}\)\(\boxed{\text{4}}\)\(\boxed{\text{2}}\)\(\boxed{\text{)}}\)\(\boxed{\text{enter}}\). El gráfico se muestra a la derecha:
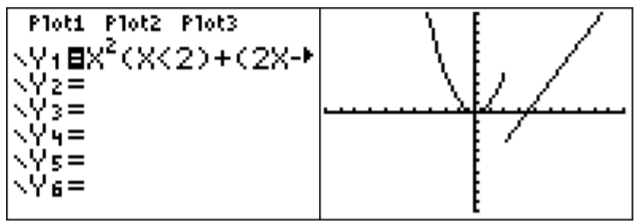
El significado de\(y=(x<2)\) como función es que es igual a\(1\) cuando es verdad y\(0\) cuando es falso. En otras palabras, la expresión\((x<2)\) es\(1\) cuándo\(x<2\) y de\(0\) otra manera. Puedes usar esta idea para graficar funciones más complicadas. Por ejemplo para ingresar\(x+2\) para\(0<x<3\) usted podría ingresar\((x+2)(0<x)(x<3)\).
Nota: Al graficar funciones definidas por partes, la gráfica a veces es diferente de lo que se espera. Consulte la sección de errores comunes para interpretar la gráfica resultante a continuación.
Graficar con coordenadas polares
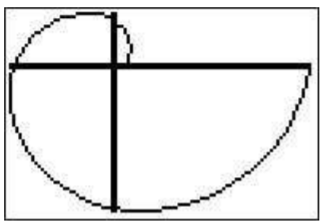
Supongamos que quiere graficar la curva\(r=\theta+\sin\theta\). Prensa\(\boxed{\text{mode}}\). En la cuarta línea resalte 'Pol' y presiona\(\boxed{\text{enter}}\) (asegúrate de que también en modo radián)
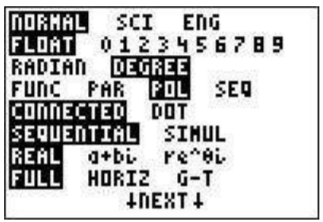
y prensa\(\boxed{y=}\). Tu menú tendrá una lista\(r_1, r_2,...\). Después del\(r_1\) tipo\(\boxed{\text{X,T,}\theta,n}\)\(\boxed{\text{+}}\)\(\boxed{\sin}\)\(\boxed{\text{X,T,}\theta,n}\)\(\boxed{\text{)}}\). Después para ver el tipo de gráfico\(\boxed{\text{graph}}\). Es posible que tenga que ajustar su ventana (ajuste de zoom) para ver la espiral resultante.
Graficar con coordenadas paramétricas
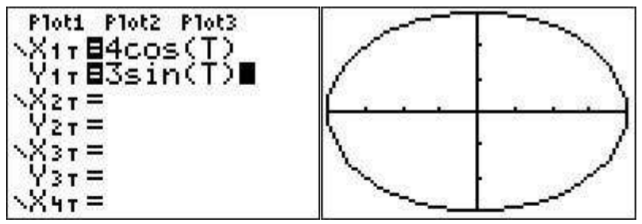
Supongamos que desea graficar la curva dada por\(y(t)=3\sin(t), x(t)=4\cos(t)\). Primero tenemos que ajustar el modo a modo paramétrico: presione\(\boxed{\text{mode}}\) y resalte 'PAR' en la cuarta línea y presione\(\boxed{\text{enter}}\).
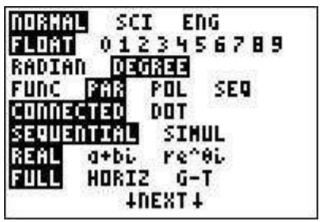
Ahora ve a la pantalla gráfica. Verás una lista que comienza con X\(_{1T}\) e Y\(_{1T}\). A la derecha del\(_{1T}\) tipo X\(\boxed{\text{4}}\)\(\boxed{\cos}\)\(\boxed{\text{X,T,}\theta,n}\) y a la derecha del\(_{1T}\) tipo\(\boxed{\text{3}}\)\(\boxed{\sin}\)\(\boxed{\text{X,T,}\theta,n}\) Y. Después para ver la gráfica presione\(\boxed{\text{graph}}\). Es posible que necesite\(\boxed{\text{zoom}}\)\(\boxed{\text{0}}\) (zoomfit) para ver la elipse resultante. (Además, tenga en cuenta que la escala puede ser engañosa, es posible que desee\(\boxed{\text{zoom}}\)\(\boxed{\text{5}}\) para una comprensión más clara de la gráfica).