2.3: Espectroscopia infrarroja (IR) - Mirando las vibraciones moleculares
- Page ID
- 76805

Hasta ahora nos hemos concentrado en la absorción (y emisión) de energía asociada con transiciones de electrones entre niveles de energía cuantificados. Sin embargo, como discutimos anteriormente, las energías de electrones no son las únicas energías cuantificadas a nivel atómico/molecular. En las moléculas se cuantifican tanto las vibraciones como las rotaciones, pero las energías involucradas son mucho más bajas que las necesarias para romper enlaces. Comencemos con el más simple de los sistemas moleculares, que consiste en dos átomos unidos entre sí. En tal sistema, los átomos pueden moverse hacia adelante y hacia atrás en relación entre sí a lo largo del eje de enlace (vibraciones). A medida que vibran y cambian las velocidades de rotación (y direcciones), la energía potencial del sistema cambia (¿Por qué es eso? ¿Qué factores influyen en estos cambios?). También hay movimientos asociados con rotaciones alrededor de los bonos. Pero (extrañamente, y cuántico-mecánicamente) en lugar de poder asumir cualquier valor, también se cuantifican las energías de estas vibraciones (y rotaciones). Las brechas de energía entre los estados de energía vibratoria tienden a estar en el rango de radiación infrarroja. Si tres o más átomos están unidos entre sí, la molécula también puede doblarse, cambiando el ángulo de enlace o la forma de la molécula. [6]
La radiación infrarroja es de menor energía que la luz visible (longitud de onda más larga, frecuencia más baja). Probablemente esté familiarizado con las lámparas de calor IR que se utilizan para calentar y gafas de visión nocturna que permiten al usuario “ver” por la noche. [7] Recordemos que los objetos tienden a emitir radiación (el fenómeno se llama radiación de cuerpo negro) ya que la energía cinética de los átomos y moléculas en el objeto se convierte en radiación electromagnética. Alrededor de 300K (temperatura ambiente o temperatura corporal) la radiación emitida se encuentra en la región IR del espectro. [8] Por el contrario, cuando la radiación IR cae sobre nuestra piel, lo sentimos como una sensación de calentamiento, principalmente porque está haciendo que las moléculas de nuestra piel vibren y roten, aumentando la energía cinética y por lo tanto la temperatura.
Cuando investigamos la luz absorbida o emitida a medida que las moléculas sufren cambios de energía vibratoria se conoce como espectroscopia infrarroja. [9] ¿Por qué, podría preguntarse, nos interesan las vibraciones de las moléculas? Las vibraciones, rotaciones y movimientos de flexión de las moléculas están influenciados por la estructura de la molécula en su conjunto (así como su entorno). El resultado es que muchas moléculas y fragmentos de moléculas tienen patrones de absorción IR muy distintivos que pueden ser utilizados para identificarlos. La espectroscopia infrarroja nos permite identificar sustancias a partir de patrones en el laboratorio y, por ejemplo, en nubes de polvo interestelares. La presencia de moléculas bastante complejas en el espacio (a cientos de millones de años luz de distancia de la tierra) se ha detectado mediante el uso de la espectroscopia IR.
Los tipos de cambios que se pueden detectar mediante espectroscopia IR están asociados tanto con el estiramiento (vibraciones de) un enlace particular, como con movimientos asociados con tres o más átomos como flexión o torsión. Considera el metano por ejemplo: Cada\(\mathrm{C-H}\) enlace puede vibrar por separado, pero también podemos imaginar que podrían vibrar “en fase” (al mismo tiempo) para que los\(\mathrm{C-H}\) enlaces se alarguen y se acorten al mismo tiempo. A este movimiento se le llama el tramo simétrico. Por el contrario, podemos imaginar que uno podría alargarse a medida que el otro se acorta: a esto se le llama estiramiento asimétrico. Además, la molécula puede doblarse y retorcerse de varias maneras para que haya bastantes “modos vibracionales” posibles. [10]
Modos vibracionales de CH 2
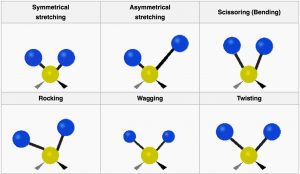
Aquí vemos los modos vibracionales para parte de una molécula orgánica con un\(\mathrm{CH}_{2}\) group. Not all these modes can be observed through infrared absorption and emission: vibrations that do not change the dipole movement (or charge distribution) for the molecules (for example, the symmetrical stretch) do not result in absorption of IR radiation, but since there are plenty of other vibrational modes[11] we can always detect the presence of symmetrical molecules like methane (and most other molecules) by IR spectroscopy. In addition, the more the charge distribution changes as the bond stretches, the greater the intensity of the peak. Therefore, as we will see, polar molecules tend to have stronger absorptions than non-polar molecules.
For historical reasons, IR spectra are typically plotted as transmittance (that is the amount of light that is allowed through the sample) versus wavenumber (\(\mathrm{cm}^{-1}\)).[12] That is, the peaks are inverted, so that at the top of the spectrum 100% of the light is transmitted and at the bottom it is all absorbed.
The position of the absorption in an IR spectrum depends three main factors:
- Bondstrength: it makes sense that the energy needed to stretch a bond (i.e. make it vibrate) depends on the strength of the bond. Therefore, multiple bonds appear at higher frequency (wavenumber) than single bonds.
- Whether the vibrations involved involve bond stretching or bending: it is easier to bend a molecule than to stretch a bond.
- The massesoftheatoms in a particular bond or group of atoms: bonds to very light atoms (particularly appear at higher frequency).[13]
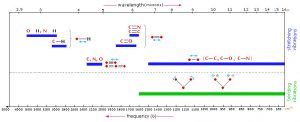
The figure below shows each of the general areas of the IR spectrum and the types of bonds that give rise to absorptions in each area of the spectrum. In general \(\mathrm{C-H}\), \(\mathrm{O-H}\), and \(\mathrm{N-H}\) bond stretches appear above \(3000 \mathrm{ cm}^{-1}\). Between \(2500\) and \(2000\) is typically where triple-bond stretches appear. Between \(2000\) and \(1500 \mathrm{ cm}^{-1}\) is the region where double-bond stretches appear, and the region below \(1600\) is called the fingerprint region. Typically, there are many peaks in this fingerprint region which may correspond to \(\mathrm{C-C}\), \(\mathrm{C-O}\) and \(\mathrm{C-N}\) stretches and many of the bending modes. In fact, this region is usually so complex that it is not possible to assign all the peaks, but rather the pattern of peaks may be compared to a database of compounds for identification purposes.
Vibrational Frequencies for Common Bond Types or Functional Groups
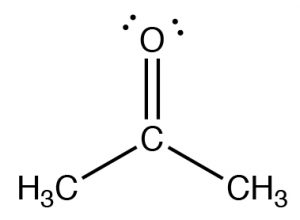
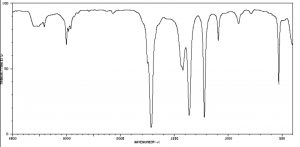
The figure below (\(\downarrow\)) shows a spectrum of acetone (\(\rightarrow\)) in which you can see a number of absorptions, the strongest of which appears around \(1710 \mathrm{ cm}^{-1}\). Note also that there is a discontinuity in scale above and below \(2000 \mathrm{ cm}^{-1}\). The strong peak around \(1710 \mathrm{ cm}^{-1}\) can be ascribed to one particular part of the acetone molecule: the \(\mathrm{C=O}\) (or carbonyl) group. It turns out that carbonyl groups can be identified by the presence of a strong peak in this region although the wavenumber of absorption may change a little depending on the chemical environment of the carbonyl. The presence of a strong peak between around \(1700 \mathrm{ cm}^{-1}\) almost always signifies the presence of a \(\mathrm{C=O}\) group within the molecule, while its shift from \(1700 \mathrm{ cm}^{-1}\) is influenced by the structure of the rest of the molecule.