Saltar al contenido principal
LibreTexts Español

14.2: Un conjunto de datos ilustrativo

  • Page ID
    151295
  • \( \newcommand{\vecs}[1]{\overset { \scriptstyle \rightharpoonup} {\mathbf{#1}} } \)

    \( \newcommand{\vecd}[1]{\overset{-\!-\!\rightharpoonup}{\vphantom{a}\smash {#1}}} \)

    \( \newcommand{\id}{\mathrm{id}}\) \( \newcommand{\Span}{\mathrm{span}}\)

    ( \newcommand{\kernel}{\mathrm{null}\,}\) \( \newcommand{\range}{\mathrm{range}\,}\)

    \( \newcommand{\RealPart}{\mathrm{Re}}\) \( \newcommand{\ImaginaryPart}{\mathrm{Im}}\)

    \( \newcommand{\Argument}{\mathrm{Arg}}\) \( \newcommand{\norm}[1]{\| #1 \|}\)

    \( \newcommand{\inner}[2]{\langle #1, #2 \rangle}\)

    \( \newcommand{\Span}{\mathrm{span}}\)

    \( \newcommand{\id}{\mathrm{id}}\)

    \( \newcommand{\Span}{\mathrm{span}}\)

    \( \newcommand{\kernel}{\mathrm{null}\,}\)

    \( \newcommand{\range}{\mathrm{range}\,}\)

    \( \newcommand{\RealPart}{\mathrm{Re}}\)

    \( \newcommand{\ImaginaryPart}{\mathrm{Im}}\)

    \( \newcommand{\Argument}{\mathrm{Arg}}\)

    \( \newcommand{\norm}[1]{\| #1 \|}\)

    \( \newcommand{\inner}[2]{\langle #1, #2 \rangle}\)

    \( \newcommand{\Span}{\mathrm{span}}\) \( \newcommand{\AA}{\unicode[.8,0]{x212B}}\)

    \( \newcommand{\vectorA}[1]{\vec{#1}}      % arrow\)

    \( \newcommand{\vectorAt}[1]{\vec{\text{#1}}}      % arrow\)

    \( \newcommand{\vectorB}[1]{\overset { \scriptstyle \rightharpoonup} {\mathbf{#1}} } \)

    \( \newcommand{\vectorC}[1]{\textbf{#1}} \)

    \( \newcommand{\vectorD}[1]{\overrightarrow{#1}} \)

    \( \newcommand{\vectorDt}[1]{\overrightarrow{\text{#1}}} \)

    \( \newcommand{\vectE}[1]{\overset{-\!-\!\rightharpoonup}{\vphantom{a}\smash{\mathbf {#1}}}} \)

    \( \newcommand{\vecs}[1]{\overset { \scriptstyle \rightharpoonup} {\mathbf{#1}} } \)

    \( \newcommand{\vecd}[1]{\overset{-\!-\!\rightharpoonup}{\vphantom{a}\smash {#1}}} \)

    \(\newcommand{\avec}{\mathbf a}\) \(\newcommand{\bvec}{\mathbf b}\) \(\newcommand{\cvec}{\mathbf c}\) \(\newcommand{\dvec}{\mathbf d}\) \(\newcommand{\dtil}{\widetilde{\mathbf d}}\) \(\newcommand{\evec}{\mathbf e}\) \(\newcommand{\fvec}{\mathbf f}\) \(\newcommand{\nvec}{\mathbf n}\) \(\newcommand{\pvec}{\mathbf p}\) \(\newcommand{\qvec}{\mathbf q}\) \(\newcommand{\svec}{\mathbf s}\) \(\newcommand{\tvec}{\mathbf t}\) \(\newcommand{\uvec}{\mathbf u}\) \(\newcommand{\vvec}{\mathbf v}\) \(\newcommand{\wvec}{\mathbf w}\) \(\newcommand{\xvec}{\mathbf x}\) \(\newcommand{\yvec}{\mathbf y}\) \(\newcommand{\zvec}{\mathbf z}\) \(\newcommand{\rvec}{\mathbf r}\) \(\newcommand{\mvec}{\mathbf m}\) \(\newcommand{\zerovec}{\mathbf 0}\) \(\newcommand{\onevec}{\mathbf 1}\) \(\newcommand{\real}{\mathbb R}\) \(\newcommand{\twovec}[2]{\left[\begin{array}{r}#1 \\ #2 \end{array}\right]}\) \(\newcommand{\ctwovec}[2]{\left[\begin{array}{c}#1 \\ #2 \end{array}\right]}\) \(\newcommand{\threevec}[3]{\left[\begin{array}{r}#1 \\ #2 \\ #3 \end{array}\right]}\) \(\newcommand{\cthreevec}[3]{\left[\begin{array}{c}#1 \\ #2 \\ #3 \end{array}\right]}\) \(\newcommand{\fourvec}[4]{\left[\begin{array}{r}#1 \\ #2 \\ #3 \\ #4 \end{array}\right]}\) \(\newcommand{\cfourvec}[4]{\left[\begin{array}{c}#1 \\ #2 \\ #3 \\ #4 \end{array}\right]}\) \(\newcommand{\fivevec}[5]{\left[\begin{array}{r}#1 \\ #2 \\ #3 \\ #4 \\ #5 \\ \end{array}\right]}\) \(\newcommand{\cfivevec}[5]{\left[\begin{array}{c}#1 \\ #2 \\ #3 \\ #4 \\ #5 \\ \end{array}\right]}\) \(\newcommand{\mattwo}[4]{\left[\begin{array}{rr}#1 \amp #2 \\ #3 \amp #4 \\ \end{array}\right]}\) \(\newcommand{\laspan}[1]{\text{Span}\{#1\}}\) \(\newcommand{\bcal}{\cal B}\) \(\newcommand{\ccal}{\cal C}\) \(\newcommand{\scal}{\cal S}\) \(\newcommand{\wcal}{\cal W}\) \(\newcommand{\ecal}{\cal E}\) \(\newcommand{\coords}[2]{\left\{#1\right\}_{#2}}\) \(\newcommand{\gray}[1]{\color{gray}{#1}}\) \(\newcommand{\lgray}[1]{\color{lightgray}{#1}}\) \(\newcommand{\rank}{\operatorname{rank}}\) \(\newcommand{\row}{\text{Row}}\) \(\newcommand{\col}{\text{Col}}\) \(\renewcommand{\row}{\text{Row}}\) \(\newcommand{\nul}{\text{Nul}}\) \(\newcommand{\var}{\text{Var}}\) \(\newcommand{\corr}{\text{corr}}\) \(\newcommand{\len}[1]{\left|#1\right|}\) \(\newcommand{\bbar}{\overline{\bvec}}\) \(\newcommand{\bhat}{\widehat{\bvec}}\) \(\newcommand{\bperp}{\bvec^\perp}\) \(\newcommand{\xhat}{\widehat{\xvec}}\) \(\newcommand{\vhat}{\widehat{\vvec}}\) \(\newcommand{\uhat}{\widehat{\uvec}}\) \(\newcommand{\what}{\widehat{\wvec}}\) \(\newcommand{\Sighat}{\widehat{\Sigma}}\) \(\newcommand{\lt}{<}\) \(\newcommand{\gt}{>}\) \(\newcommand{\amp}{&}\) \(\definecolor{fillinmathshade}{gray}{0.9}\)

    Supongamos que te has involucrado en un ensayo clínico en el que estás probando un nuevo medicamento antidepresivo llamado Joyzepam. Para construir una prueba justa de la efectividad del medicamento, el estudio involucra tres fármacos separados para ser administrados. Uno es un placebo, y el otro es un medicamento antidepresivo/ansiolítico existente llamado Anxifree. Se recluta una colección de 18 participantes con depresión moderada a severa para su prueba inicial. Debido a que los medicamentos a veces se administran junto con la terapia psicológica, tu estudio incluye a 9 personas que se someten a terapia cognitivo-conductual (TCC) y a 9 que no lo son. A los participantes se les asigna aleatoriamente (doblemente cegado, por supuesto) un tratamiento, de tal manera que hay 3 personas con TCC y 3 personas sin terapia asignadas a cada uno de los 3 medicamentos. Un psicólogo evalúa el estado de ánimo de cada persona después de una carrera de 3 meses con cada medicamento: y la mejora general en el estado de ánimo de cada persona se evalúa en una escala que va de −5 a +5.

    Con eso como diseño del estudio, veamos ahora lo que tenemos en el archivo de datos:

    load( "./rbook-master/data/clinicaltrial.Rdata" ) # load data
    str(clin.trial)
    ## 'data.frame':    18 obs. of  3 variables:
    ##  $ drug     : Factor w/ 3 levels "placebo","anxifree",..: 1 1 1 2 2 2 3 3 3 1 ...
    ##  $ therapy  : Factor w/ 2 levels "no.therapy","CBT": 1 1 1 1 1 1 1 1 1 2 ...
    ##  $ mood.gain: num  0.5 0.3 0.1 0.6 0.4 0.2 1.4 1.7 1.3 0.6 ...

    Entonces tenemos un solo marco de datos llamado clin.trial, que contiene tres variables; fármaco, terapia y estado de ánimo.ganancia. A continuación, vamos a imprimir el marco de datos para tener una idea de cómo se ven realmente los datos.

    print( clin.trial )
    ##        drug    therapy mood.gain
    ## 1   placebo no.therapy       0.5
    ## 2   placebo no.therapy       0.3
    ## 3   placebo no.therapy       0.1
    ## 4  anxifree no.therapy       0.6
    ## 5  anxifree no.therapy       0.4
    ## 6  anxifree no.therapy       0.2
    ## 7  joyzepam no.therapy       1.4
    ## 8  joyzepam no.therapy       1.7
    ## 9  joyzepam no.therapy       1.3
    ## 10  placebo        CBT       0.6
    ## 11  placebo        CBT       0.9
    ## 12  placebo        CBT       0.3
    ## 13 anxifree        CBT       1.1
    ## 14 anxifree        CBT       0.8
    ## 15 anxifree        CBT       1.2
    ## 16 joyzepam        CBT       1.8
    ## 17 joyzepam        CBT       1.3
    ## 18 joyzepam        CBT       1.4

    Para los efectos de este capítulo, lo que realmente nos interesa es el efecto de la droga en el estado de ánimo.ganancia. Lo primero que hay que hacer es calcular algunas estadísticas descriptivas y dibujar algunas gráficas. En el Capítulo 5 discutimos una variedad de funciones diferentes que pueden ser utilizadas para este propósito. Por ejemplo, podemos usar la función xtabs () para ver cuántas personas tenemos en cada grupo:

    xtabs( ~drug, clin.trial )
    ## drug
    ##  placebo anxifree joyzepam 
    ##        6        6        6

    De igual manera, podemos usar la función aggregate () para calcular medias y desviaciones estándar para la variable de mood.gain desglosada por la cual se administró el fármaco:

    aggregate( mood.gain ~ drug, clin.trial, mean )
    ##       drug mood.gain
    ## 1  placebo 0.4500000
    ## 2 anxifree 0.7166667
    ## 3 joyzepam 1.4833333
    
    aggregate( mood.gain ~ drug, clin.trial, sd )
    ##       drug mood.gain
    ## 1  placebo 0.2810694
    ## 2 anxifree 0.3920034
    ## 3 joyzepam 0.2136976

    Finalmente, podemos usar plotmeans () del paquete gplots para producir una imagen bonita.

    library(gplots)
    plotmeans(  formula = mood.gain ~ drug,  # plot mood.gain by drug
                 data = clin.trial,           # the data frame
                 xlab = "Drug Administered",  # x-axis label
                 ylab = "Mood Gain",          # y-axis label
                 n.label = FALSE              # don't display sample size
     )

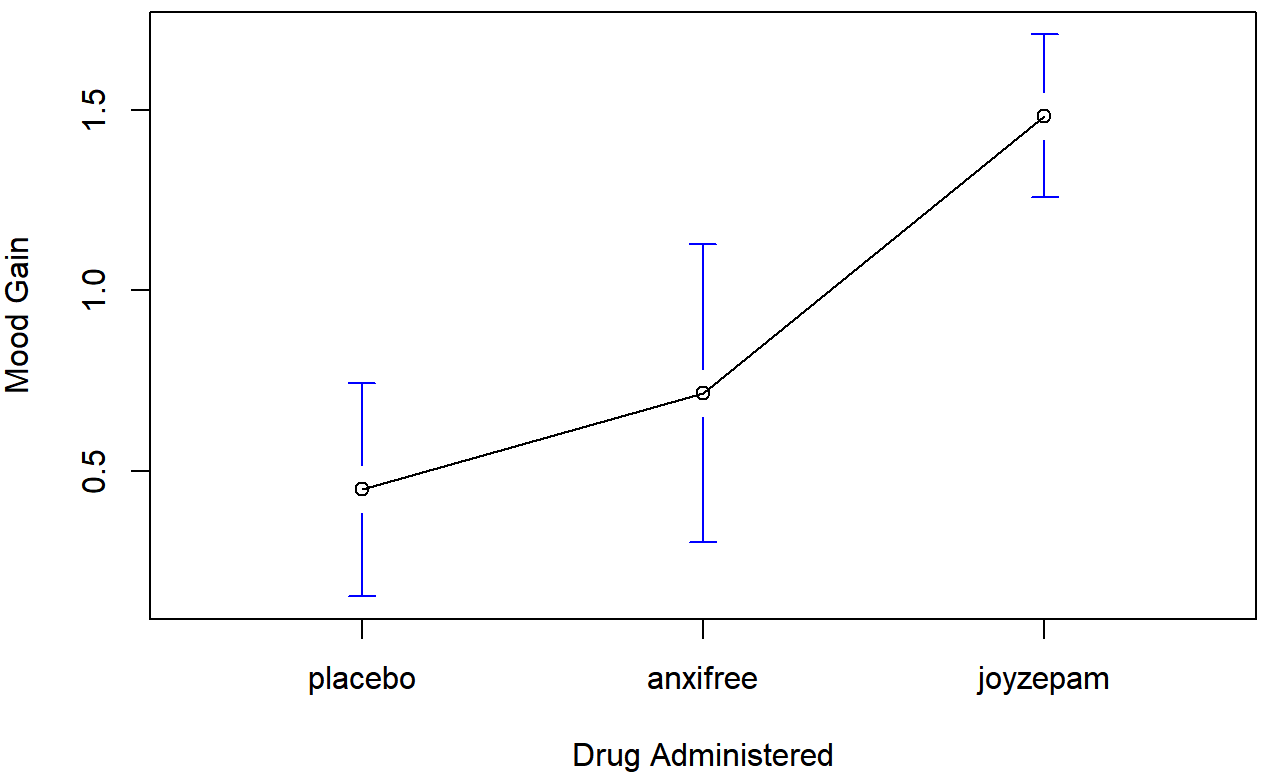
    Los resultados se muestran en la Figura 14.1, que traza la ganancia promedio del estado de ánimo para las tres condiciones; las barras de error muestran intervalos de confianza del 95%. Como deja claro la trama, hay una mejora mayor en el estado de ánimo para los participantes en el grupo Joyzepam que para el grupo Anxifree o el grupo placebo. El grupo Anxifree muestra una ganancia de humor mayor que el grupo control, pero la diferencia no es tan grande.

    La pregunta que queremos responder es: ¿estas diferencias son “reales”, o solo se deben a la casualidad?

    ## Warning: package 'gplots' was built under R version 3.5.2
    ## 
    ## Attaching package: 'gplots'
    
    ## The following object is masked from 'package:stats':
    ## 
    ##     lowess
    moodgain-1.png
    Figura 14.1: Ganancia promedio del estado de ánimo en función del fármaco administrado. Las barras de error representan intervalos de confianza del 95% asociados con cada una de las medias del grupo.

    This page titled 14.2: Un conjunto de datos ilustrativo is shared under a CC BY-SA 4.0 license and was authored, remixed, and/or curated by Danielle Navarro via source content that was edited to the style and standards of the LibreTexts platform.