5.2: Funciones de Probabilidad Continua
- Page ID
- 153263
\( \newcommand{\vecs}[1]{\overset { \scriptstyle \rightharpoonup} {\mathbf{#1}} } \)
\( \newcommand{\vecd}[1]{\overset{-\!-\!\rightharpoonup}{\vphantom{a}\smash {#1}}} \)
\( \newcommand{\id}{\mathrm{id}}\) \( \newcommand{\Span}{\mathrm{span}}\)
( \newcommand{\kernel}{\mathrm{null}\,}\) \( \newcommand{\range}{\mathrm{range}\,}\)
\( \newcommand{\RealPart}{\mathrm{Re}}\) \( \newcommand{\ImaginaryPart}{\mathrm{Im}}\)
\( \newcommand{\Argument}{\mathrm{Arg}}\) \( \newcommand{\norm}[1]{\| #1 \|}\)
\( \newcommand{\inner}[2]{\langle #1, #2 \rangle}\)
\( \newcommand{\Span}{\mathrm{span}}\)
\( \newcommand{\id}{\mathrm{id}}\)
\( \newcommand{\Span}{\mathrm{span}}\)
\( \newcommand{\kernel}{\mathrm{null}\,}\)
\( \newcommand{\range}{\mathrm{range}\,}\)
\( \newcommand{\RealPart}{\mathrm{Re}}\)
\( \newcommand{\ImaginaryPart}{\mathrm{Im}}\)
\( \newcommand{\Argument}{\mathrm{Arg}}\)
\( \newcommand{\norm}[1]{\| #1 \|}\)
\( \newcommand{\inner}[2]{\langle #1, #2 \rangle}\)
\( \newcommand{\Span}{\mathrm{span}}\) \( \newcommand{\AA}{\unicode[.8,0]{x212B}}\)
\( \newcommand{\vectorA}[1]{\vec{#1}} % arrow\)
\( \newcommand{\vectorAt}[1]{\vec{\text{#1}}} % arrow\)
\( \newcommand{\vectorB}[1]{\overset { \scriptstyle \rightharpoonup} {\mathbf{#1}} } \)
\( \newcommand{\vectorC}[1]{\textbf{#1}} \)
\( \newcommand{\vectorD}[1]{\overrightarrow{#1}} \)
\( \newcommand{\vectorDt}[1]{\overrightarrow{\text{#1}}} \)
\( \newcommand{\vectE}[1]{\overset{-\!-\!\rightharpoonup}{\vphantom{a}\smash{\mathbf {#1}}}} \)
\( \newcommand{\vecs}[1]{\overset { \scriptstyle \rightharpoonup} {\mathbf{#1}} } \)
\( \newcommand{\vecd}[1]{\overset{-\!-\!\rightharpoonup}{\vphantom{a}\smash {#1}}} \)
\(\newcommand{\avec}{\mathbf a}\) \(\newcommand{\bvec}{\mathbf b}\) \(\newcommand{\cvec}{\mathbf c}\) \(\newcommand{\dvec}{\mathbf d}\) \(\newcommand{\dtil}{\widetilde{\mathbf d}}\) \(\newcommand{\evec}{\mathbf e}\) \(\newcommand{\fvec}{\mathbf f}\) \(\newcommand{\nvec}{\mathbf n}\) \(\newcommand{\pvec}{\mathbf p}\) \(\newcommand{\qvec}{\mathbf q}\) \(\newcommand{\svec}{\mathbf s}\) \(\newcommand{\tvec}{\mathbf t}\) \(\newcommand{\uvec}{\mathbf u}\) \(\newcommand{\vvec}{\mathbf v}\) \(\newcommand{\wvec}{\mathbf w}\) \(\newcommand{\xvec}{\mathbf x}\) \(\newcommand{\yvec}{\mathbf y}\) \(\newcommand{\zvec}{\mathbf z}\) \(\newcommand{\rvec}{\mathbf r}\) \(\newcommand{\mvec}{\mathbf m}\) \(\newcommand{\zerovec}{\mathbf 0}\) \(\newcommand{\onevec}{\mathbf 1}\) \(\newcommand{\real}{\mathbb R}\) \(\newcommand{\twovec}[2]{\left[\begin{array}{r}#1 \\ #2 \end{array}\right]}\) \(\newcommand{\ctwovec}[2]{\left[\begin{array}{c}#1 \\ #2 \end{array}\right]}\) \(\newcommand{\threevec}[3]{\left[\begin{array}{r}#1 \\ #2 \\ #3 \end{array}\right]}\) \(\newcommand{\cthreevec}[3]{\left[\begin{array}{c}#1 \\ #2 \\ #3 \end{array}\right]}\) \(\newcommand{\fourvec}[4]{\left[\begin{array}{r}#1 \\ #2 \\ #3 \\ #4 \end{array}\right]}\) \(\newcommand{\cfourvec}[4]{\left[\begin{array}{c}#1 \\ #2 \\ #3 \\ #4 \end{array}\right]}\) \(\newcommand{\fivevec}[5]{\left[\begin{array}{r}#1 \\ #2 \\ #3 \\ #4 \\ #5 \\ \end{array}\right]}\) \(\newcommand{\cfivevec}[5]{\left[\begin{array}{c}#1 \\ #2 \\ #3 \\ #4 \\ #5 \\ \end{array}\right]}\) \(\newcommand{\mattwo}[4]{\left[\begin{array}{rr}#1 \amp #2 \\ #3 \amp #4 \\ \end{array}\right]}\) \(\newcommand{\laspan}[1]{\text{Span}\{#1\}}\) \(\newcommand{\bcal}{\cal B}\) \(\newcommand{\ccal}{\cal C}\) \(\newcommand{\scal}{\cal S}\) \(\newcommand{\wcal}{\cal W}\) \(\newcommand{\ecal}{\cal E}\) \(\newcommand{\coords}[2]{\left\{#1\right\}_{#2}}\) \(\newcommand{\gray}[1]{\color{gray}{#1}}\) \(\newcommand{\lgray}[1]{\color{lightgray}{#1}}\) \(\newcommand{\rank}{\operatorname{rank}}\) \(\newcommand{\row}{\text{Row}}\) \(\newcommand{\col}{\text{Col}}\) \(\renewcommand{\row}{\text{Row}}\) \(\newcommand{\nul}{\text{Nul}}\) \(\newcommand{\var}{\text{Var}}\) \(\newcommand{\corr}{\text{corr}}\) \(\newcommand{\len}[1]{\left|#1\right|}\) \(\newcommand{\bbar}{\overline{\bvec}}\) \(\newcommand{\bhat}{\widehat{\bvec}}\) \(\newcommand{\bperp}{\bvec^\perp}\) \(\newcommand{\xhat}{\widehat{\xvec}}\) \(\newcommand{\vhat}{\widehat{\vvec}}\) \(\newcommand{\uhat}{\widehat{\uvec}}\) \(\newcommand{\what}{\widehat{\wvec}}\) \(\newcommand{\Sighat}{\widehat{\Sigma}}\) \(\newcommand{\lt}{<}\) \(\newcommand{\gt}{>}\) \(\newcommand{\amp}{&}\) \(\definecolor{fillinmathshade}{gray}{0.9}\)Comenzamos definiendo una función de densidad de probabilidad continua. Usamos la notación de funciones\(f(x)\). El álgebra intermedia puede haber sido su primera introducción formal a las funciones. En el estudio de la probabilidad, las funciones que estudiamos son especiales. Definimos la función\(f(x)\) para que el área entre ésta y el eje x sea igual a una probabilidad. Dado que la probabilidad máxima es uno, el área máxima también es uno. Para distribuciones continuas de probabilidad, PROBABILIDAD = ÁREA.
Ejemplo\(\PageIndex{1}\)
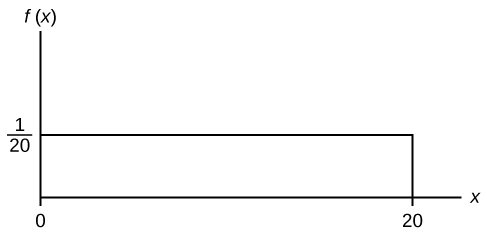
Considera la función\(f(x) = \frac{1}{20}\) para\(0 \leq x \leq 20\). \(x =\)un número real. La gráfica de\(f(x) = \frac{1}{20}\) es una línea horizontal. Sin embargo, ya que\(0 \leq x \leq 20\),\(f(x)\) se restringe a la porción entre\(x = 0\) y\(x = 20\), inclusive.
\[f(x) = \frac{1}{20} \text{ for } 0 \leq x \leq 20.\]
La gráfica de\(f(x) = \frac{1}{20}\) es un segmento de línea horizontal cuando\(0 \leq x \leq 20\).
El área entre\(f(x) = \frac{1}{20}\) donde\(0 \leq x \leq 20\) y el eje x es el área de un rectángulo con base = 20 y altura =\(\frac{1}{20}\).
\[AREA = 20 \left(\frac{1}{20} \right) = 1\]
Supongamos que queremos encontrar el área entre\(f(x) = \frac{1}{20}\) y el eje x donde\(0 < x < 2\).
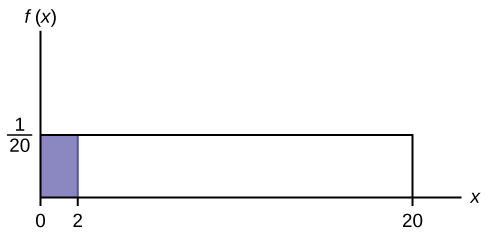
\[AREA = (2 - 0) \left(\dfrac{1}{20} \right) = 0.1\]
\((2 - 0) = 2 = \text{base of a rectangle}\)
RECORDATORIO: área de un rectángulo = (base) (altura).
El área corresponde a una probabilidad. La probabilidad de que x esté entre cero y dos es 0.1, que se puede escribir matemáticamente como\(P(0 < x < 2) = P(x < 2) = 0.1\).
Supongamos que queremos encontrar el área entre\(f(x) = \frac{1}{20}\) y el eje x donde\(4 < x < 15\).
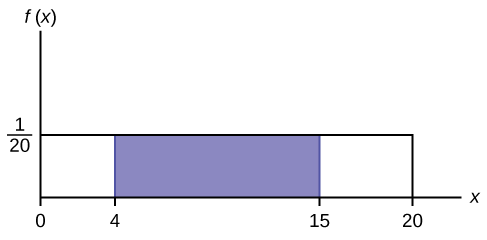
\(\text{AREA} = (15 – 4)(\frac{1}{20}) = 0.55\)
\(\text{AREA} = (15 – 4)(\frac{1}{20}) = 0.55\)
\((15 – 4) = 11 = \text{the base of a rectangle}(15 – 4) = 11 = \text{the base of a rectangle}\)
El área corresponde a la probabilidad\(P(4 < x < 15) = 0.55\).
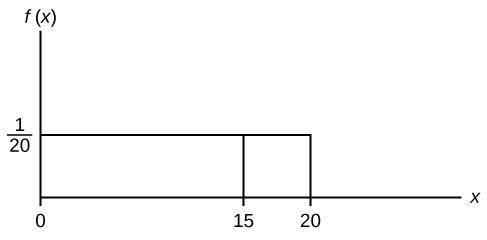
Supongamos que queremos encontrar\(P(x = 15)\). En una gráfica x-y,\(x = 15\) hay una línea vertical. Una línea vertical no tiene ancho (o ancho cero). Por lo tanto,\(P(x = 15) = (\text{base})(\text{height}) = (0)\left(\frac{1}{20}\right) = 0\)
\(P(X \leq x)\)(se puede escribir como\(P(X < x)\) para distribuciones continuas) se llama la función de distribución acumulativa o CDF. Observe el símbolo “menor o igual a”. Podemos usar el CDF para calcular\(P(X > x)\). El CDF da “área a la izquierda” y\(P(X > x)\) da “área a la derecha”. Calculamos\(P(X > x)\) para distribuciones continuas de la siguiente manera:\(P(X > x) = 1 – P(X < x)\).
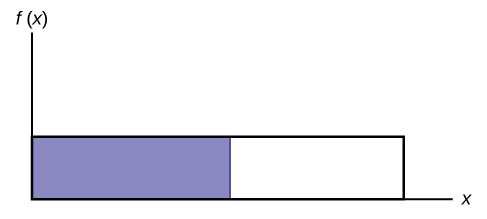
Etiquete la gráfica con\(f(x)\) y\(x\). Escala los\(y\) ejes\(x\) y con el máximo\(x\) y\(y\) los valores. \(f(x) = \frac{1}{20}\),\(0 \leq x \leq 20\).
Para calcular la probabilidad que\(x\) se encuentra entre dos valores, mira la siguiente gráfica. Sombra la región entre\(x = 2.3\) y\(x = 12.7\). Después calcula el área sombreada de un rectángulo.
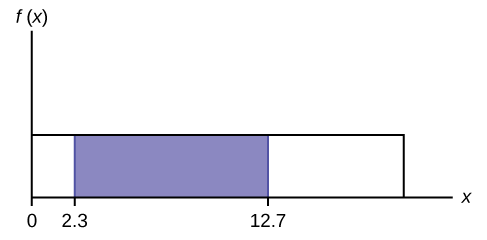
\[P(2.3 < x < 12.7) = (\text{base})(\text{height}) = (12.7−2.3)\left(\dfrac{1}{20}\right) = 0.52\]
Ejercicio\(\PageIndex{1}\)
Considera la función\(f(x) = \frac{1}{8}\) para\(0 \leq x \leq 8\). Dibuja la gráfica de\(f(x)\) y encuentra\(P(2.5 < x < 7.5)\).
- Responder
-
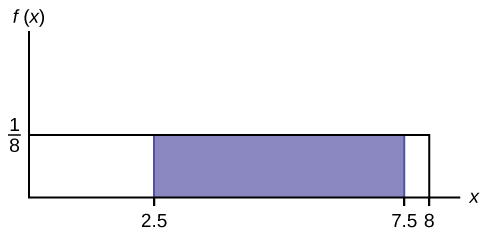
Figura\(\PageIndex{7}\) \(P (2.5 < x < 7.5) = 0.625\)
Resumen
La función de densidad de probabilidad (pdf) se utiliza para describir probabilidades para variables aleatorias continuas. El área bajo la curva de densidad entre dos puntos corresponde a la probabilidad de que la variable caiga entre esos dos valores. En otras palabras, el área bajo la curva de densidad entre los puntos a y b es igual a\(P(a < x < b)\). La función de distribución acumulativa (cdf) da la probabilidad como área. Si\(X\) es una variable aleatoria continua, la función de densidad de probabilidad (pdf),\(f(x)\), se utiliza para dibujar la gráfica de la distribución de probabilidad. El área total bajo la gráfica de\(f(x)\) es uno. El área bajo la gráfica de\(f(x)\) y entre los valores a y b da la probabilidad\(P(a < x < b)\).
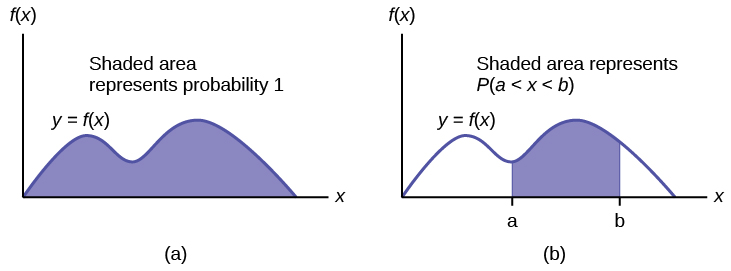
La función de distribución acumulativa (cdf) de\(X\) se define por\(P(X \leq x)\). Es una función de\(x\) que da la probabilidad de que la variable aleatoria sea menor o igual a\(x\).
Revisión de Fórmula
Función de densidad de probabilidad (pdf)\(f(x)\):
- \(f(x) \geq 0\)
- El área total bajo la curva\(f(x)\) es uno.
Función de distribución acumulativa (cdf):\(P(X \leq x)\)


