13.1: Error de muestreo (Sección @ref {samplingerror})
- Page ID
- 150697

\( \newcommand{\vecs}[1]{\overset { \scriptstyle \rightharpoonup} {\mathbf{#1}} } \) \( \newcommand{\vecd}[1]{\overset{-\!-\!\rightharpoonup}{\vphantom{a}\smash {#1}}} \)\(\newcommand{\id}{\mathrm{id}}\) \( \newcommand{\Span}{\mathrm{span}}\) \( \newcommand{\kernel}{\mathrm{null}\,}\) \( \newcommand{\range}{\mathrm{range}\,}\) \( \newcommand{\RealPart}{\mathrm{Re}}\) \( \newcommand{\ImaginaryPart}{\mathrm{Im}}\) \( \newcommand{\Argument}{\mathrm{Arg}}\) \( \newcommand{\norm}[1]{\| #1 \|}\) \( \newcommand{\inner}[2]{\langle #1, #2 \rangle}\) \( \newcommand{\Span}{\mathrm{span}}\) \(\newcommand{\id}{\mathrm{id}}\) \( \newcommand{\Span}{\mathrm{span}}\) \( \newcommand{\kernel}{\mathrm{null}\,}\) \( \newcommand{\range}{\mathrm{range}\,}\) \( \newcommand{\RealPart}{\mathrm{Re}}\) \( \newcommand{\ImaginaryPart}{\mathrm{Im}}\) \( \newcommand{\Argument}{\mathrm{Arg}}\) \( \newcommand{\norm}[1]{\| #1 \|}\) \( \newcommand{\inner}[2]{\langle #1, #2 \rangle}\) \( \newcommand{\Span}{\mathrm{span}}\)\(\newcommand{\AA}{\unicode[.8,0]{x212B}}\)
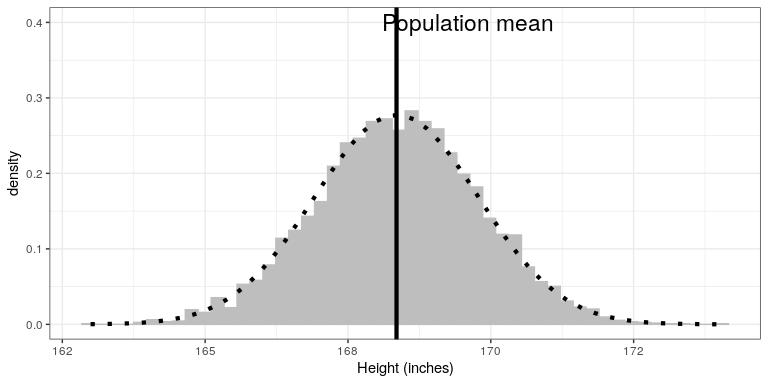
Aquí vamos a muestrear repetidamente de la variable Altura NHANES para obtener la distribución muestral de la media.
sampSize <- 50 # size of sample
nsamps <- 5000 # number of samples we will take

# set up variable to store all of the results
sampMeans <- tibble(meanHeight=rep(NA,nsamps))

# Loop through and repeatedly sample and compute the mean
for (i in 1:nsamps) {
  sampMeans$meanHeight[i] <- NHANES_adult %>%
    sample_n(sampSize) %>%
    summarize(meanHeight=mean(Height)) %>%
    pull(meanHeight)
}
Ahora vamos a trazar la distribución de muestreo. También se sobrepondremos la distribución muestral de la media predicha sobre la base de la media poblacional y la desviación estándar, para mostrar que describe adecuadamente la distribución muestral real.
# pipe the sampMeans data frame into ggplot
sampMeans %>%
  ggplot(aes(meanHeight)) +
  # create histogram using density rather than count
  geom_histogram(
    aes(y = ..density..),
    bins = 50,
    col = "gray",
    fill = "gray"
  ) +
  # add a vertical line for the population mean
  geom_vline(xintercept = mean(NHANES_adult$Height),
             size=1.5) +
  # add a label for the line
  annotate(
    "text",
    x = 169.6,
    y = .4,
    label = "Population mean",
    size=6
  ) +
  # label the x axis
  labs(x = "Height (inches)") +
  # add normal based on population mean/sd
  stat_function(
      fun = dnorm, n = sampSize,
      args = list(
        mean = mean(NHANES_adult$Height),
        sd = sd(NHANES_adult$Height)/sqrt(sampSize)
      ),
      size = 1.5,
      color = "black",
      linetype='dotted'
    )