15.1: Generación de Muestras Aleatorias (Sección @ref {generar-números aleatorios})
- Page ID
- 150602

\( \newcommand{\vecs}[1]{\overset { \scriptstyle \rightharpoonup} {\mathbf{#1}} } \) \( \newcommand{\vecd}[1]{\overset{-\!-\!\rightharpoonup}{\vphantom{a}\smash {#1}}} \)\(\newcommand{\id}{\mathrm{id}}\) \( \newcommand{\Span}{\mathrm{span}}\) \( \newcommand{\kernel}{\mathrm{null}\,}\) \( \newcommand{\range}{\mathrm{range}\,}\) \( \newcommand{\RealPart}{\mathrm{Re}}\) \( \newcommand{\ImaginaryPart}{\mathrm{Im}}\) \( \newcommand{\Argument}{\mathrm{Arg}}\) \( \newcommand{\norm}[1]{\| #1 \|}\) \( \newcommand{\inner}[2]{\langle #1, #2 \rangle}\) \( \newcommand{\Span}{\mathrm{span}}\) \(\newcommand{\id}{\mathrm{id}}\) \( \newcommand{\Span}{\mathrm{span}}\) \( \newcommand{\kernel}{\mathrm{null}\,}\) \( \newcommand{\range}{\mathrm{range}\,}\) \( \newcommand{\RealPart}{\mathrm{Re}}\) \( \newcommand{\ImaginaryPart}{\mathrm{Im}}\) \( \newcommand{\Argument}{\mathrm{Arg}}\) \( \newcommand{\norm}[1]{\| #1 \|}\) \( \newcommand{\inner}[2]{\langle #1, #2 \rangle}\) \( \newcommand{\Span}{\mathrm{span}}\)\(\newcommand{\AA}{\unicode[.8,0]{x212B}}\)
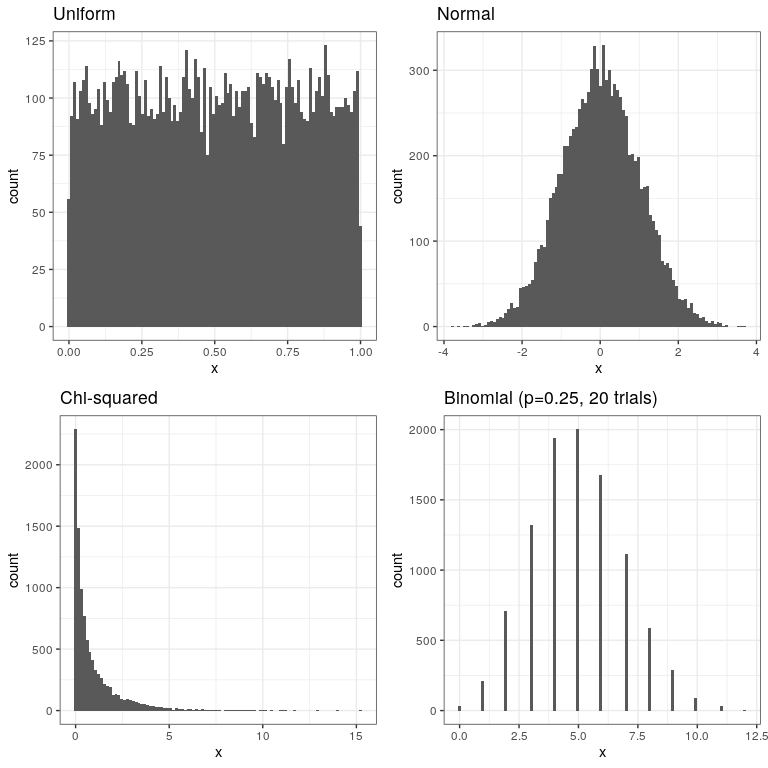
Aquí generaremos muestras aleatorias a partir de una serie de distribuciones diferentes y trazaremos sus histogramas.
nsamples <- 10000
nhistbins <- 100

# uniform distribution

p1 <-
  tibble(
    x = runif(nsamples)
  ) %>%
  ggplot((aes(x))) +
  geom_histogram(bins = nhistbins) +
  labs(title = "Uniform")

# normal distribution
p2 <-
  tibble(
    x = rnorm(nsamples)
  ) %>%
  ggplot(aes(x)) +
  geom_histogram(bins = nhistbins) +
  labs(title = "Normal")

# Chi-squared distribution
p3 <-
  tibble(
    x = rnorm(nsamples)
  ) %>%
  ggplot(aes(x)) +
  geom_histogram(bins = nhistbins) +
  labs(title = "Normal")

# Chi-squared distribution
p3 <-
  tibble(
    x = rchisq(nsamples, df=1)
  ) %>%
  ggplot(aes(x)) +
  geom_histogram(bins = nhistbins) +
  labs(title = "Chi-squared")

# Poisson distribution
p4 <-
  tibble(
    x = rbinom(nsamples, 20, 0.25)
  ) %>%
  ggplot(aes(x)) +
  geom_histogram(bins = nhistbins) +
  labs(title = "Binomial (p=0.25, 20 trials)")


plot_grid(p1, p2, p3, p4, ncol = 2)