7.5: Parcelas con dos variables
\newcommand{\vecs}[1]{\overset { \scriptstyle \rightharpoonup} {\mathbf{#1}} }
\newcommand{\vecd}[1]{\overset{-\!-\!\rightharpoonup}{\vphantom{a}\smash {#1}}}
\newcommand{\id}{\mathrm{id}} \newcommand{\Span}{\mathrm{span}}
( \newcommand{\kernel}{\mathrm{null}\,}\) \newcommand{\range}{\mathrm{range}\,}
\newcommand{\RealPart}{\mathrm{Re}} \newcommand{\ImaginaryPart}{\mathrm{Im}}
\newcommand{\Argument}{\mathrm{Arg}} \newcommand{\norm}[1]{\| #1 \|}
\newcommand{\inner}[2]{\langle #1, #2 \rangle}
\newcommand{\Span}{\mathrm{span}}
\newcommand{\id}{\mathrm{id}}
\newcommand{\Span}{\mathrm{span}}
\newcommand{\kernel}{\mathrm{null}\,}
\newcommand{\range}{\mathrm{range}\,}
\newcommand{\RealPart}{\mathrm{Re}}
\newcommand{\ImaginaryPart}{\mathrm{Im}}
\newcommand{\Argument}{\mathrm{Arg}}
\newcommand{\norm}[1]{\| #1 \|}
\newcommand{\inner}[2]{\langle #1, #2 \rangle}
\newcommand{\Span}{\mathrm{span}} \newcommand{\AA}{\unicode[.8,0]{x212B}}
\newcommand{\vectorA}[1]{\vec{#1}} % arrow
\newcommand{\vectorAt}[1]{\vec{\text{#1}}} % arrow
\newcommand{\vectorB}[1]{\overset { \scriptstyle \rightharpoonup} {\mathbf{#1}} }
\newcommand{\vectorC}[1]{\textbf{#1}}
\newcommand{\vectorD}[1]{\overrightarrow{#1}}
\newcommand{\vectorDt}[1]{\overrightarrow{\text{#1}}}
\newcommand{\vectE}[1]{\overset{-\!-\!\rightharpoonup}{\vphantom{a}\smash{\mathbf {#1}}}}
\newcommand{\vecs}[1]{\overset { \scriptstyle \rightharpoonup} {\mathbf{#1}} }
\newcommand{\vecd}[1]{\overset{-\!-\!\rightharpoonup}{\vphantom{a}\smash {#1}}}
\newcommand{\avec}{\mathbf a} \newcommand{\bvec}{\mathbf b} \newcommand{\cvec}{\mathbf c} \newcommand{\dvec}{\mathbf d} \newcommand{\dtil}{\widetilde{\mathbf d}} \newcommand{\evec}{\mathbf e} \newcommand{\fvec}{\mathbf f} \newcommand{\nvec}{\mathbf n} \newcommand{\pvec}{\mathbf p} \newcommand{\qvec}{\mathbf q} \newcommand{\svec}{\mathbf s} \newcommand{\tvec}{\mathbf t} \newcommand{\uvec}{\mathbf u} \newcommand{\vvec}{\mathbf v} \newcommand{\wvec}{\mathbf w} \newcommand{\xvec}{\mathbf x} \newcommand{\yvec}{\mathbf y} \newcommand{\zvec}{\mathbf z} \newcommand{\rvec}{\mathbf r} \newcommand{\mvec}{\mathbf m} \newcommand{\zerovec}{\mathbf 0} \newcommand{\onevec}{\mathbf 1} \newcommand{\real}{\mathbb R} \newcommand{\twovec}[2]{\left[\begin{array}{r}#1 \\ #2 \end{array}\right]} \newcommand{\ctwovec}[2]{\left[\begin{array}{c}#1 \\ #2 \end{array}\right]} \newcommand{\threevec}[3]{\left[\begin{array}{r}#1 \\ #2 \\ #3 \end{array}\right]} \newcommand{\cthreevec}[3]{\left[\begin{array}{c}#1 \\ #2 \\ #3 \end{array}\right]} \newcommand{\fourvec}[4]{\left[\begin{array}{r}#1 \\ #2 \\ #3 \\ #4 \end{array}\right]} \newcommand{\cfourvec}[4]{\left[\begin{array}{c}#1 \\ #2 \\ #3 \\ #4 \end{array}\right]} \newcommand{\fivevec}[5]{\left[\begin{array}{r}#1 \\ #2 \\ #3 \\ #4 \\ #5 \\ \end{array}\right]} \newcommand{\cfivevec}[5]{\left[\begin{array}{c}#1 \\ #2 \\ #3 \\ #4 \\ #5 \\ \end{array}\right]} \newcommand{\mattwo}[4]{\left[\begin{array}{rr}#1 \amp #2 \\ #3 \amp #4 \\ \end{array}\right]} \newcommand{\laspan}[1]{\text{Span}\{#1\}} \newcommand{\bcal}{\cal B} \newcommand{\ccal}{\cal C} \newcommand{\scal}{\cal S} \newcommand{\wcal}{\cal W} \newcommand{\ecal}{\cal E} \newcommand{\coords}[2]{\left\{#1\right\}_{#2}} \newcommand{\gray}[1]{\color{gray}{#1}} \newcommand{\lgray}[1]{\color{lightgray}{#1}} \newcommand{\rank}{\operatorname{rank}} \newcommand{\row}{\text{Row}} \newcommand{\col}{\text{Col}} \renewcommand{\row}{\text{Row}} \newcommand{\nul}{\text{Nul}} \newcommand{\var}{\text{Var}} \newcommand{\corr}{\text{corr}} \newcommand{\len}[1]{\left|#1\right|} \newcommand{\bbar}{\overline{\bvec}} \newcommand{\bhat}{\widehat{\bvec}} \newcommand{\bperp}{\bvec^\perp} \newcommand{\xhat}{\widehat{\xvec}} \newcommand{\vhat}{\widehat{\vvec}} \newcommand{\uhat}{\widehat{\uvec}} \newcommand{\what}{\widehat{\wvec}} \newcommand{\Sighat}{\widehat{\Sigma}} \newcommand{\lt}{<} \newcommand{\gt}{>} \newcommand{\amp}{&} \definecolor{fillinmathshade}{gray}{0.9}Echemos un vistazo al kilometraje por fabricante de automóviles. Trazaremos una variable continua por una nominal.
Primero, hagamos una gráfica de barras eligiendo el “resumen” estadístico y eligiendo la función “media” para resumir los datos.
ggplot(mpg, aes(manufacturer, hwy)) +
  geom_bar(stat = "summary", fun.y = "mean")  +
  ylab('Highway mileage')
Un problema con esta trama es que es difícil leer algunas de las etiquetas porque se superponen. ¿Cómo podríamos arreglarlo? Pista: busca en la web “ggplot rotate x axis labels” y agrega el comando apropiado.
TBD: fijar
ggplot(mpg, aes(manufacturer, hwy)) +
  geom_bar(stat = "summary", fun.y = "mean")  +
  ylab('Highway mileage')
7.5.1 Agregar variables
¿Y si quisiéramos agregar otra variable a la mezcla? A lo mejor el año del auto también es importante tener en cuenta. Tenemos algunas opciones aquí. Primero, podrías mapear la variable a otra estética.
# first, year needs to be converted to a factor
mpg$year <- factor(mpg$year)

ggplot(mpg, aes(manufacturer, hwy, fill = year)) +
  geom_bar(stat = "summary", fun.y = "mean")
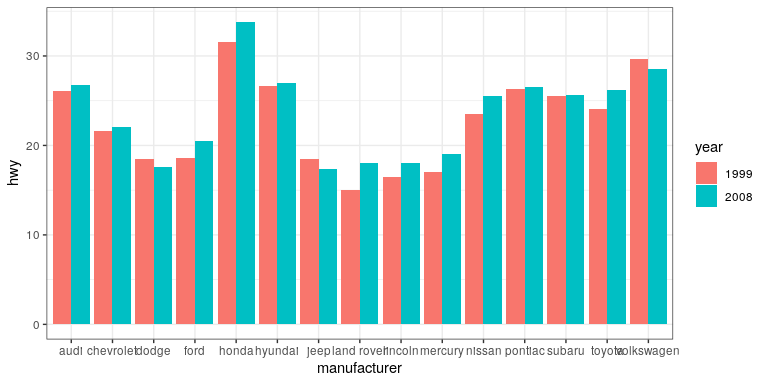
Por defecto, las barras se apilan una encima de la otra. Si quieres separarlos, puedes cambiar el argumento de posición desde su defecto a “esquivar”.
ggplot(mpg, aes(manufacturer, hwy, fill=year)) +
  geom_bar(stat = "summary",
           fun.y = "mean",
           position = "dodge")
ggplot(mpg, aes(year, hwy,
                group=manufacturer,
                color=manufacturer)) +
  geom_line(stat = "summary", fun.y = "mean")
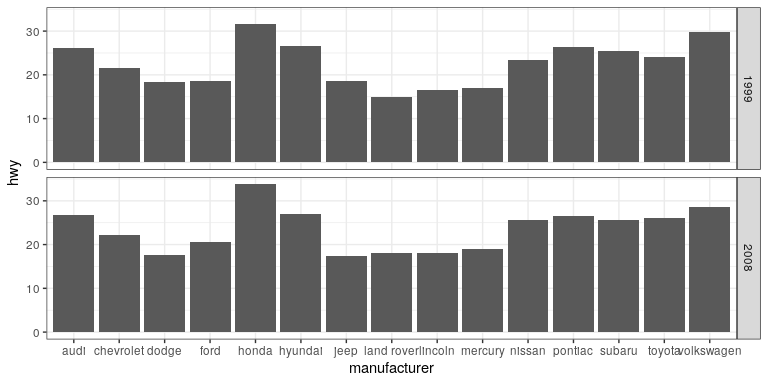
Para una trama menos desordenada visualmente, probemos facetando. Esto crea subparcelas para cada valor de la variable año.
ggplot(mpg, aes(manufacturer, hwy)) +
  # split up the bar plot into two by year
  facet_grid(year ~ .) +
  geom_bar(stat = "summary",
           fun.y = "mean")
7.5.2 Dispersión de trazado
En lugar de mirar solo los medios, podemos tener una idea de la distribución completa de los valores de kilometraje para cada fabricante.
7.5.2.1 Parcela de caja
ggplot(mpg, aes(manufacturer, hwy)) +
  geom_boxplot()
Una trama de caja (o trama de caja y bigotes) utiliza cuartiles para darnos una sensación de propagación. La línea más gruesa, en algún lugar dentro de la caja, representa la mediana. Los límites superior e inferior de la caja (las bisagras) son el primer y tercer cuartiles (¿puede utilizarlos para aproximarse al rango intercuartil?). Las líneas que se extienden desde las bisagras son los puntos de datos restantes, excluyendo los valores atípicos, los cuales se trazan como puntos individuales.
7.5.2.2 Barras de error
Ahora, hagamos algo un poco más complejo, pero mucho más útil —vamos a crear nuestro propio resumen de los datos, para que podamos elegir qué estadística de resumen trazar y también calcular una medida de dispersión de nuestra elección.
# summarise data
mpg_summary <- mpg %>%
  group_by(manufacturer) %>%
  summarise(n = n(),
            mean_hwy = mean(hwy),
            sd_hwy = sd(hwy))

# compute confidence intervals for the error bars
# (we'll talk about this later in the course!)

limits <- aes(
  # compute the lower limit of the error bar
  ymin = mean_hwy - 1.96 * sd_hwy / sqrt(n),
  # compute the upper limit
  ymax = mean_hwy + 1.96 * sd_hwy / sqrt(n))

# now we're giving ggplot the mean for each group,
# instead of the datapoints themselves

ggplot(mpg_summary, aes(manufacturer, mean_hwy)) +
  # we set stat = "identity" on the summary data
  geom_bar(stat = "identity") +
  # we create error bars using the limits we computed above
geom_errorbar(limits, width=0.5) 
Las barras de error no siempre significan lo mismo; es importante determinar si estás viendo, por ejemplo, el error estándar o los intervalos de confianza (de los que hablaremos más adelante en el curso).
7.5.2.2.1 Minimizar la tinta que no contiene datos
La trama que acabamos de crear es agradable y todo, pero es difícil de ver. Los gráficos de barras agregan mucha tinta que no nos ayuda a comparar los tamaños de los motores entre fabricantes. Del mismo modo, el ancho de las barras de error no agrega ninguna información. Ajustemos qué geometría usamos y ajustemos la apariencia de las barras de error.
ggplot(mpg_summary, aes(manufacturer, mean_hwy)) +
  # switch to point instead of bar to minimize ink used
  geom_point() +
  # remove the horizontal parts of the error bars
geom_errorbar(limits, width = 0) 
Se ve mucho más limpio, pero nuestros puntos están por todas partes. Hagamos un ajuste final para que aprender algo de esta trama sea un poco más fácil.
mpg_summary_ordered <- mpg_summary %>%
  mutate(
    # we sort manufacturers by mean engine size
    manufacturer = reorder(manufacturer, -mean_hwy)
  )

ggplot(mpg_summary_ordered, aes(manufacturer, mean_hwy)) +
  geom_point() +
geom_errorbar(limits, width = 0) 
7.5.3 Gráfica de dispersión
Cuando tenemos múltiples variables continuas, podemos usar puntos para trazar cada variable en un eje. Esto se conoce como un diagrama de dispersión. Has visto este ejemplo en tu lectura.
ggplot(mpg, aes(displ, hwy)) +
  geom_point()
7.5.3.1 Capas de datos
Podemos agregar capas de datos a esta gráfica, como una línea de mejor ajuste. Utilizamos una geometría conocida como suave para lograr esto.
ggplot(mpg, aes(displ, hwy)) +
  geom_point() +
  geom_smooth(color = "black")
Podemos agregar puntos y una línea suave para otro conjunto de datos también (eficiencia en la ciudad en lugar de en la carretera).
ggplot(mpg) +
  geom_point(aes(displ, hwy), color = "grey") +
  geom_smooth(aes(displ, hwy), color = "grey") +
  geom_point(aes(displ, cty), color = "limegreen") +
  geom_smooth(aes(displ, cty), color = "limegreen")


