
10.3: Transiciones de fase
- Page ID
- 75271

\( \newcommand{\vecs}[1]{\overset { \scriptstyle \rightharpoonup} {\mathbf{#1}} } \)
\( \newcommand{\vecd}[1]{\overset{-\!-\!\rightharpoonup}{\vphantom{a}\smash {#1}}} \)
\( \newcommand{\dsum}{\displaystyle\sum\limits} \)
\( \newcommand{\dint}{\displaystyle\int\limits} \)
\( \newcommand{\dlim}{\displaystyle\lim\limits} \)
\( \newcommand{\id}{\mathrm{id}}\) \( \newcommand{\Span}{\mathrm{span}}\)
( \newcommand{\kernel}{\mathrm{null}\,}\) \( \newcommand{\range}{\mathrm{range}\,}\)
\( \newcommand{\RealPart}{\mathrm{Re}}\) \( \newcommand{\ImaginaryPart}{\mathrm{Im}}\)
\( \newcommand{\Argument}{\mathrm{Arg}}\) \( \newcommand{\norm}[1]{\| #1 \|}\)
\( \newcommand{\inner}[2]{\langle #1, #2 \rangle}\)
\( \newcommand{\Span}{\mathrm{span}}\)
\( \newcommand{\id}{\mathrm{id}}\)
\( \newcommand{\Span}{\mathrm{span}}\)
\( \newcommand{\kernel}{\mathrm{null}\,}\)
\( \newcommand{\range}{\mathrm{range}\,}\)
\( \newcommand{\RealPart}{\mathrm{Re}}\)
\( \newcommand{\ImaginaryPart}{\mathrm{Im}}\)
\( \newcommand{\Argument}{\mathrm{Arg}}\)
\( \newcommand{\norm}[1]{\| #1 \|}\)
\( \newcommand{\inner}[2]{\langle #1, #2 \rangle}\)
\( \newcommand{\Span}{\mathrm{span}}\) \( \newcommand{\AA}{\unicode[.8,0]{x212B}}\)
\( \newcommand{\vectorA}[1]{\vec{#1}} % arrow\)
\( \newcommand{\vectorAt}[1]{\vec{\text{#1}}} % arrow\)
\( \newcommand{\vectorB}[1]{\overset { \scriptstyle \rightharpoonup} {\mathbf{#1}} } \)
\( \newcommand{\vectorC}[1]{\textbf{#1}} \)
\( \newcommand{\vectorD}[1]{\overrightarrow{#1}} \)
\( \newcommand{\vectorDt}[1]{\overrightarrow{\text{#1}}} \)
\( \newcommand{\vectE}[1]{\overset{-\!-\!\rightharpoonup}{\vphantom{a}\smash{\mathbf {#1}}}} \)
\( \newcommand{\vecs}[1]{\overset { \scriptstyle \rightharpoonup} {\mathbf{#1}} } \)
\(\newcommand{\longvect}{\overrightarrow}\)
\( \newcommand{\vecd}[1]{\overset{-\!-\!\rightharpoonup}{\vphantom{a}\smash {#1}}} \)
\(\newcommand{\avec}{\mathbf a}\) \(\newcommand{\bvec}{\mathbf b}\) \(\newcommand{\cvec}{\mathbf c}\) \(\newcommand{\dvec}{\mathbf d}\) \(\newcommand{\dtil}{\widetilde{\mathbf d}}\) \(\newcommand{\evec}{\mathbf e}\) \(\newcommand{\fvec}{\mathbf f}\) \(\newcommand{\nvec}{\mathbf n}\) \(\newcommand{\pvec}{\mathbf p}\) \(\newcommand{\qvec}{\mathbf q}\) \(\newcommand{\svec}{\mathbf s}\) \(\newcommand{\tvec}{\mathbf t}\) \(\newcommand{\uvec}{\mathbf u}\) \(\newcommand{\vvec}{\mathbf v}\) \(\newcommand{\wvec}{\mathbf w}\) \(\newcommand{\xvec}{\mathbf x}\) \(\newcommand{\yvec}{\mathbf y}\) \(\newcommand{\zvec}{\mathbf z}\) \(\newcommand{\rvec}{\mathbf r}\) \(\newcommand{\mvec}{\mathbf m}\) \(\newcommand{\zerovec}{\mathbf 0}\) \(\newcommand{\onevec}{\mathbf 1}\) \(\newcommand{\real}{\mathbb R}\) \(\newcommand{\twovec}[2]{\left[\begin{array}{r}#1 \\ #2 \end{array}\right]}\) \(\newcommand{\ctwovec}[2]{\left[\begin{array}{c}#1 \\ #2 \end{array}\right]}\) \(\newcommand{\threevec}[3]{\left[\begin{array}{r}#1 \\ #2 \\ #3 \end{array}\right]}\) \(\newcommand{\cthreevec}[3]{\left[\begin{array}{c}#1 \\ #2 \\ #3 \end{array}\right]}\) \(\newcommand{\fourvec}[4]{\left[\begin{array}{r}#1 \\ #2 \\ #3 \\ #4 \end{array}\right]}\) \(\newcommand{\cfourvec}[4]{\left[\begin{array}{c}#1 \\ #2 \\ #3 \\ #4 \end{array}\right]}\) \(\newcommand{\fivevec}[5]{\left[\begin{array}{r}#1 \\ #2 \\ #3 \\ #4 \\ #5 \\ \end{array}\right]}\) \(\newcommand{\cfivevec}[5]{\left[\begin{array}{c}#1 \\ #2 \\ #3 \\ #4 \\ #5 \\ \end{array}\right]}\) \(\newcommand{\mattwo}[4]{\left[\begin{array}{rr}#1 \amp #2 \\ #3 \amp #4 \\ \end{array}\right]}\) \(\newcommand{\laspan}[1]{\text{Span}\{#1\}}\) \(\newcommand{\bcal}{\cal B}\) \(\newcommand{\ccal}{\cal C}\) \(\newcommand{\scal}{\cal S}\) \(\newcommand{\wcal}{\cal W}\) \(\newcommand{\ecal}{\cal E}\) \(\newcommand{\coords}[2]{\left\{#1\right\}_{#2}}\) \(\newcommand{\gray}[1]{\color{gray}{#1}}\) \(\newcommand{\lgray}[1]{\color{lightgray}{#1}}\) \(\newcommand{\rank}{\operatorname{rank}}\) \(\newcommand{\row}{\text{Row}}\) \(\newcommand{\col}{\text{Col}}\) \(\renewcommand{\row}{\text{Row}}\) \(\newcommand{\nul}{\text{Nul}}\) \(\newcommand{\var}{\text{Var}}\) \(\newcommand{\corr}{\text{corr}}\) \(\newcommand{\len}[1]{\left|#1\right|}\) \(\newcommand{\bbar}{\overline{\bvec}}\) \(\newcommand{\bhat}{\widehat{\bvec}}\) \(\newcommand{\bperp}{\bvec^\perp}\) \(\newcommand{\xhat}{\widehat{\xvec}}\) \(\newcommand{\vhat}{\widehat{\vvec}}\) \(\newcommand{\uhat}{\widehat{\uvec}}\) \(\newcommand{\what}{\widehat{\wvec}}\) \(\newcommand{\Sighat}{\widehat{\Sigma}}\) \(\newcommand{\lt}{<}\) \(\newcommand{\gt}{>}\) \(\newcommand{\amp}{&}\) \(\definecolor{fillinmathshade}{gray}{0.9}\)- Definir transiciones de fase y temperaturas de transición de fase
- Explicar la relación entre las temperaturas de transición de fase y las fuerzas de atracción intermoleculares
- Describir los procesos representados por las curvas típicas de calentamiento y enfriamiento, y calcular los flujos de calor y los cambios de entalpía que acompañan a estos procesos
Somos testigos y utilizamos cambios de estado físico, o transiciones de fase, de muchas maneras. Como un ejemplo de importancia global, considere la evaporación, condensación, congelación y fusión del agua. Estos cambios de estado son aspectos esenciales del ciclo hídrico de nuestra tierra así como muchos otros fenómenos naturales y procesos tecnológicos de importancia central para nuestras vidas. En este módulo se exploran los aspectos esenciales de las transiciones de fase.
Vaporización y Condensación
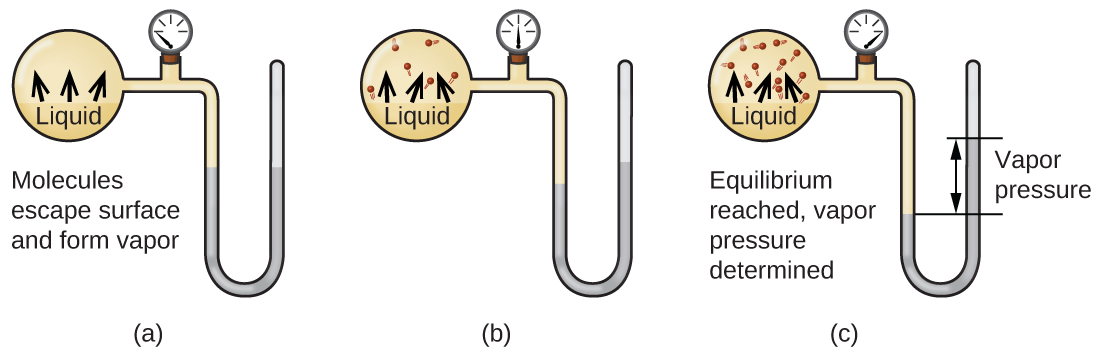
Cuando un líquido se vaporiza en un recipiente cerrado, las moléculas de gas no pueden escapar. A medida que estas moléculas en fase gaseosa se mueven aleatoriamente, ocasionalmente colisionarán con la superficie de la fase condensada, y en algunos casos, estas colisiones darán como resultado que las moléculas vuelvan a entrar en la fase condensada. El cambio de la fase gaseosa al líquido se llama condensación. Cuando la velocidad de condensación se vuelve igual a la velocidad de vaporización, ni la cantidad de líquido ni la cantidad de vapor en el recipiente cambian. Entonces se dice que el vapor en el recipiente está en equilibrio con el líquido. Tenga en cuenta que esta no es una situación estática, ya que las moléculas se intercambian continuamente entre las fases condensada y gaseosa. Tal es un ejemplo de un equilibrio dinámico, el estado de un sistema en el que los procesos recíprocos (por ejemplo, vaporización y condensación) ocurren a tasas iguales. La presión ejercida por el vapor en equilibrio con un líquido en un recipiente cerrado a una temperatura dada se denomina presión de vapor del líquido (o presión de vapor de equilibrio). El área de la superficie del líquido en contacto con un vapor y el tamaño del recipiente no tienen ningún efecto sobre la presión de vapor, aunque sí afectan el tiempo requerido para que se alcance el equilibrio. Podemos medir la presión de vapor de un líquido colocando una muestra en un recipiente cerrado, como el ilustrado en la Figura\(\PageIndex{1}\), y usando un manómetro para medir el aumento de presión que se debe al vapor en equilibrio con la fase condensada.
Las identidades químicas de las moléculas en un líquido determinan los tipos (y fortalezas) de atracciones intermoleculares posibles; en consecuencia, diferentes sustancias exhibirán diferentes presiones de vapor de equilibrio. Las fuerzas de atracción intermolecular relativamente fuertes servirán para impedir la vaporización así como favorecer la “recaptura” de moléculas en fase gaseosa cuando chocan con la superficie del líquido, resultando en una presión de vapor relativamente baja. Las débiles atracciones intermoleculares presentan menos barrera a la vaporización y una menor probabilidad de recaptura de gas, produciendo presiones de vapor relativamente altas. El siguiente ejemplo ilustra esta dependencia de la presión de vapor de las fuerzas de atracción intermoleculares.
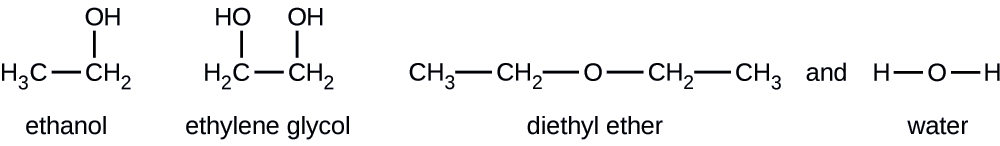
Dadas las fórmulas estructurales mostradas para estos cuatro compuestos, explicar sus presiones de vapor relativas en términos de tipos y extensiones de IMF:
Solución
El éter dietílico tiene un dipolo muy pequeño y la mayoría de sus atractivos intermoleculares son las fuerzas londinenses. Si bien esta molécula es la más grande de las cuatro bajo consideración, sus IMF son las más débiles y, como resultado, sus moléculas escapan más fácilmente del líquido. También tiene la presión de vapor más alta. Debido a su menor tamaño, el etanol exhibe fuerzas de dispersión más débiles que el éter dietílico. Sin embargo, el etanol es capaz de formar enlaces de hidrógeno y, por lo tanto, exhibe IMF globales más fuertes, lo que significa que menos moléculas escapan del líquido a cualquier temperatura dada, y así el etanol tiene una presión de vapor más baja que el éter dietílico. El agua es mucho más pequeña que cualquiera de las sustancias anteriores y exhibe fuerzas de dispersión más débiles, pero su extenso enlace de hidrógeno proporciona atracciones intermoleculares más fuertes, menos moléculas que escapan del líquido y una presión de vapor más baja que para el éter dietílico o el etanol. El etilenglicol tiene dos grupos −OH, por lo que, al igual que el agua, exhibe extensos enlaces de hidrógeno. Es mucho más grande que el agua y por lo tanto experimenta fuerzas más grandes de Londres. Sus IMF generales son las más grandes de estas cuatro sustancias, lo que significa que su velocidad de vaporización será la más lenta y, en consecuencia, su presión de vapor la más baja.
At 20 °C, the vapor pressures of several alcohols are given in this table. Explain these vapor pressures in terms of types and extents of IMFs for these alcohols:
| Compound | methanol CH3OH | ethanol C2H5OH | propanol C3H7OH | butanol C4H9OH |
|---|---|---|---|---|
| Vapor Pressure at 20 °C | 11.9 kPa | 5.95 kPa | 2.67 kPa | 0.56 kPa |
- Answer
-
All these compounds exhibit hydrogen bonding; these strong IMFs are difficult for the molecules to overcome, so the vapor pressures are relatively low. As the size of molecule increases from methanol to butanol, dispersion forces increase, which means that the vapor pressures decrease as observed:
\[P_{methanol} > P_{ethanol} > P_{propanol} > P_{butanol} \nonumber \]
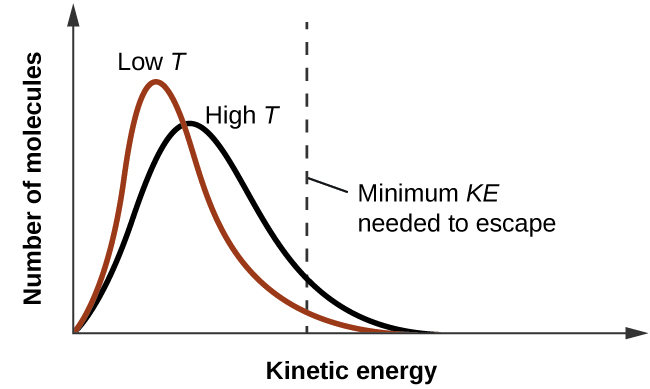
As temperature increases, the vapor pressure of a liquid also increases due to the increased average KE of its molecules. Recall that at any given temperature, the molecules of a substance experience a range of kinetic energies, with a certain fraction of molecules having a sufficient energy to overcome IMF and escape the liquid (vaporize). At a higher temperature, a greater fraction of molecules have enough energy to escape from the liquid, as shown in Figure \(\PageIndex{2}\). The escape of more molecules per unit of time and the greater average speed of the molecules that escape both contribute to the higher vapor pressure.
Boiling Points
When the vapor pressure increases enough to equal the external atmospheric pressure, the liquid reaches its boiling point. The boiling point of a liquid is the temperature at which its equilibrium vapor pressure is equal to the pressure exerted on the liquid by its gaseous surroundings. For liquids in open containers, this pressure is that due to the earth’s atmosphere. The normal boiling point of a liquid is defined as its boiling point when surrounding pressure is equal to 1 atm (101.3 kPa). Figure \(\PageIndex{3}\) shows the variation in vapor pressure with temperature for several different substances. Considering the definition of boiling point, these curves may be seen as depicting the dependence of a liquid’s boiling point on surrounding pressure.
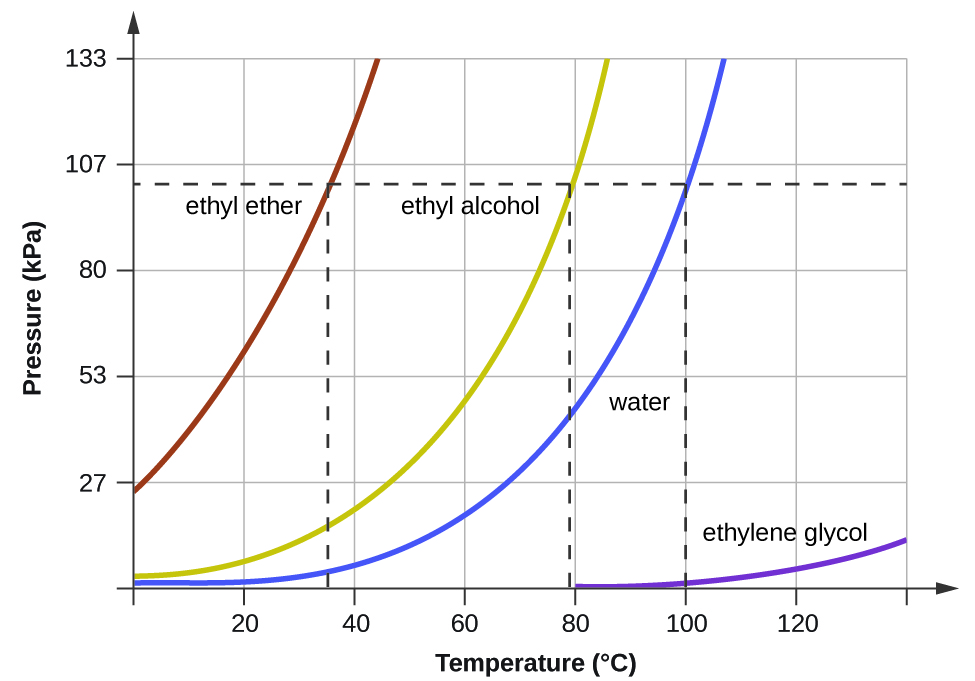
A typical atmospheric pressure in Leadville, Colorado (elevation 10,200 feet) is 68 kPa. Use the graph in Figure \(\PageIndex{3}\) to determine the boiling point of water at this elevation.
Solution
The graph of the vapor pressure of water versus temperature in Figure \(\PageIndex{3}\) indicates that the vapor pressure of water is 68 kPa at about 90 °C. Thus, at about 90 °C, the vapor pressure of water will equal the atmospheric pressure in Leadville, and water will boil.
The boiling point of ethyl ether was measured to be 10 °C at a base camp on the slopes of Mount Everest. Use Figure \(\PageIndex{3}\) to determine the approximate atmospheric pressure at the camp.
- Answer
-
Approximately 40 kPa (0.4 atm)
The quantitative relation between a substance’s vapor pressure and its temperature is described by the Clausius-Clapeyron equation:
\[P=Ae^{−ΔH_{vap}/RT} \label{10.4.1} \]
where
- \(ΔH_{vap}\) is the enthalpy of vaporization for the liquid,
- \(R\) is the gas constant, and
- \(\ln A\) is a constant whose value depends on the chemical identity of the substance.
Equation \(\ref{10.4.1}\) is often rearranged into logarithmic form to yield the linear equation:
\[\ln P=−\dfrac{ΔH_\ce{vap}}{RT}+\ln A \label{10.4.2} \]
This linear equation may be expressed in a two-point format that is convenient for use in various computations, as demonstrated in the examples and exercises that follow. If at temperature \(T_1\), the vapor pressure is \( P_1\), and at temperature \(T_2\), the vapor pressure is \(T_2\), the corresponding linear equations are:
\[\ln P_1=−\dfrac{ΔH_\ce{vap}}{RT_1}+\ln A \nonumber \]
and
\[\ln P_2=−\dfrac{ΔH_\ce{vap}}{RT_2}+\ln A \label{10.4.3} \]
Since the constant, ln A, is the same, these two equations may be rearranged to isolate \(\ln A\) and then set them equal to one another:
\(\ln P_1+\dfrac{ΔH_\ce{vap}}{RT_1}=\ln P_2+\dfrac{ΔH_\ce{vap}}{RT_2}\label{10.4.5}\)
which can be combined into:
\[\ln \left(\dfrac{P_2}{P_1}\right)=\dfrac{ΔH_\ce{vap}}{R} \left( \dfrac{1}{T_1}−\dfrac{1}{T_2}\right) \label{10.4.6} \]
Isooctane (2,2,4-trimethylpentane) has an octane rating of 100. It is used as one of the standards for the octane-rating system for gasoline. At 34.0 °C, the vapor pressure of isooctane is 10.0 kPa, and at 98.8 °C, its vapor pressure is 100.0 kPa. Use this information to estimate the enthalpy of vaporization for isooctane.
Solution
The enthalpy of vaporization, \(ΔH_\ce{vap}\), can be determined by using the Clausius-Clapeyron equation (Equation \(\ref{10.4.6}\)):
\[\ln\left(\dfrac{P_2}{P_1}\right)=\dfrac{ΔH_\ce{vap}}{R}\left(\dfrac{1}{T_1}−\dfrac{1}{T_2}\right) \nonumber \]
Since we have two vapor pressure-temperature values
- \(T_1 = 34.0^oC = 307.2\, K\)
- \(P_1 = 10.0\, kPa\) and
- \(T_2 = 98.8 ^oC = 372.0\, K\)
- \(P_2 = 100\, kPa\)
we can substitute them into this equation and solve for \(ΔH_{vap}\). Rearranging the Clausius-Clapeyron equation and solving for \(ΔH_{vap}\) yields:
\[ \begin{align*} ΔH_\ce{vap} &= \dfrac{R⋅\ln\left(\dfrac{P_2}{P_1}\right)}{\left(\dfrac{1}{T_1}−\dfrac{1}{T_2}\right)} \\[4pt] &= \dfrac{(8.3145\:J/mol⋅K)⋅\ln \left(\dfrac{100\: kPa}{10.0\: kPa}\right)}{\left(\dfrac{1}{307.2\:K}−\dfrac{1}{372.0\:K}\right)} \\[4pt] &=33,800\, J/mol =33.8\, kJ/mol \end{align*} \nonumber \]
Note that the pressure can be in any units, so long as they agree for both P values, but the temperature must be in kelvin for the Clausius-Clapeyron equation to be valid.
At 20.0 °C, the vapor pressure of ethanol is 5.95 kPa, and at 63.5 °C, its vapor pressure is 53.3 kPa. Use this information to estimate the enthalpy of vaporization for ethanol.
- Answer
-
47,782 J/mol = 47.8 kJ/mol
For benzene (C6H6), the normal boiling point is 80.1 °C and the enthalpy of vaporization is 30.8 kJ/mol. What is the boiling point of benzene in Denver, where atmospheric pressure = 83.4 kPa?
Solution
If the temperature and vapor pressure are known at one point, along with the enthalpy of vaporization, ΔHvap, then the temperature that corresponds to a different vapor pressure (or the vapor pressure that corresponds to a different temperature) can be determined by using the Clausius-Clapeyron equation (Equation \(\ref{10.4.1}\)) :
\[\ln\left(\dfrac{P_2}{P_1}\right)=\dfrac{ΔH_\ce{vap}}{R}\left(\dfrac{1}{T_1}−\dfrac{1}{T_2}\right) \nonumber \]
Since the normal boiling point is the temperature at which the vapor pressure equals atmospheric pressure at sea level, we know one vapor pressure-temperature value (\(T_1\) = 80.1 °C = 353.3 K, \(P_1\) = 101.3 kPa, \(ΔH_{vap}\) = 30.8 kJ/mol) and want to find the temperature (\(T_2\)) that corresponds to vapor pressure P2 = 83.4 kPa. We can substitute these values into the Clausius-Clapeyron equation and then solve for \(T_2\). Rearranging the Clausius-Clapeyron equation and solving for \(T_2\) yields:
\[\begin{align*}
T_2 &=\left(\dfrac{−R⋅\ln\left(\dfrac{P_2}{P_1}\right)}{ΔH_\ce{vap}}+\dfrac{1}{T_1}\right)^{−1} \\[4pt] &=\mathrm{\left(\dfrac{−(8.3145\:J/mol⋅K)⋅\ln\left(\dfrac{83.4\:kPa}{101.3\:kPa}\right)}{30,800\: J/mol}+\dfrac{1}{353.3\:K}\right)^{−1}}\\[4pt]
&=\mathrm{346.9\: K\: or\:73.8^\circ C}
\end{align*} \nonumber \]
For acetone \(\ce{(CH3)2CO}\), the normal boiling point is 56.5 °C and the enthalpy of vaporization is 31.3 kJ/mol. What is the vapor pressure of acetone at 25.0 °C?
- Answer
-
30.1 kPa
Enthalpy of Vaporization
Vaporization is an endothermic process. The cooling effect can be evident when you leave a swimming pool or a shower. When the water on your skin evaporates, it removes heat from your skin and causes you to feel cold. The energy change associated with the vaporization process is the enthalpy of vaporization, \(ΔH_{vap}\). For example, the vaporization of water at standard temperature is represented by:
\[\ce{H2O}(l)⟶\ce{H2O}(g)\hspace{20px}ΔH_\ce{vap}=\mathrm{44.01\: kJ/mol} \nonumber \]
As described in the chapter on thermochemistry, the reverse of an endothermic process is exothermic. And so, the condensation of a gas releases heat:
\[\ce{H2O}(g)⟶\ce{H2O}(l)\hspace{20px}ΔH_\ce{con}=−ΔH_\ce{vap}=\mathrm{−44.01\:kJ/mol} \nonumber \]
One way our body is cooled is by evaporation of the water in sweat (Figure \(\PageIndex{4}\)). In very hot climates, we can lose as much as 1.5 L of sweat per day. Although sweat is not pure water, we can get an approximate value of the amount of heat removed by evaporation by assuming that it is. How much heat is required to evaporate 1.5 L of water (1.5 kg) at T = 37 °C (normal body temperature); \(ΔH_{vap} = 43.46\, kJ/mol\) at 37 °C.

Solution We start with the known volume of sweat (approximated as just water) and use the given information to convert to the amount of heat needed:
\[\mathrm{1.5\cancel{L}×\dfrac{1000\cancel{g}}{1\cancel{L}}×\dfrac{1\cancel{mol}}{18\cancel{g}}×\dfrac{43.46\:kJ}{1\cancel{mol}}=3.6×10^3\:kJ} \nonumber \]
Thus, 3600 kJ of heat are removed by the evaporation of 1.5 L of water.
How much heat is required to evaporate 100.0 g of liquid ammonia, \(\ce{NH3}\), at its boiling point if its enthalpy of vaporization is 4.8 kJ/mol?
- Answer
-
28 kJ
Melting and Freezing
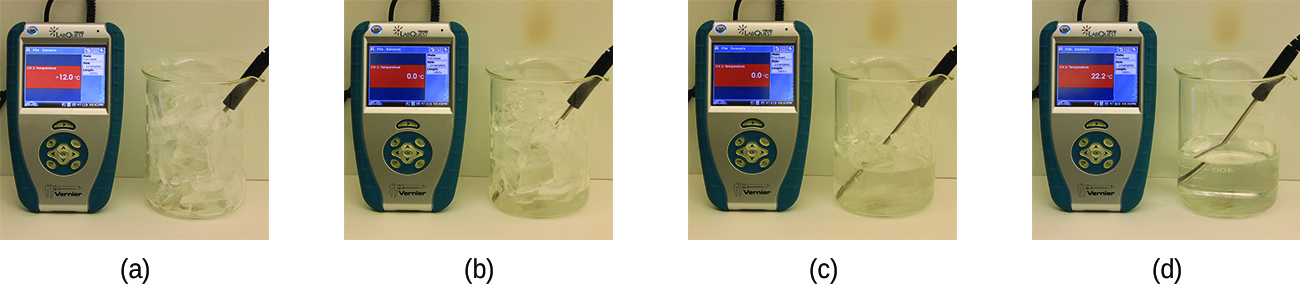
When we heat a crystalline solid, we increase the average energy of its atoms, molecules, or ions and the solid gets hotter. At some point, the added energy becomes large enough to partially overcome the forces holding the molecules or ions of the solid in their fixed positions, and the solid begins the process of transitioning to the liquid state, or melting. At this point, the temperature of the solid stops rising, despite the continual input of heat, and it remains constant until all of the solid is melted. Only after all of the solid has melted will continued heating increase the temperature of the liquid (Figure \(\PageIndex{5}\).
If we stop heating during melting and place the mixture of solid and liquid in a perfectly insulated container so no heat can enter or escape, the solid and liquid phases remain in equilibrium. This is almost the situation with a mixture of ice and water in a very good thermos bottle; almost no heat gets in or out, and the mixture of solid ice and liquid water remains for hours. In a mixture of solid and liquid at equilibrium, the reciprocal processes of melting and freezing occur at equal rates, and the quantities of solid and liquid therefore remain constant. The temperature at which the solid and liquid phases of a given substance are in equilibrium is called the melting point of the solid or the freezing point of the liquid. Use of one term or the other is normally dictated by the direction of the phase transition being considered, for example, solid to liquid (melting) or liquid to solid (freezing).
The enthalpy of fusion and the melting point of a crystalline solid depend on the strength of the attractive forces between the units present in the crystal. Molecules with weak attractive forces form crystals with low melting points. Crystals consisting of particles with stronger attractive forces melt at higher temperatures.
The amount of heat required to change one mole of a substance from the solid state to the liquid state is the enthalpy of fusion, ΔHfus of the substance. The enthalpy of fusion of ice is 6.0 kJ/mol at 0 °C. Fusion (melting) is an endothermic process:
\[\ce{H2O}_{(s)} \rightarrow \ce{H2O}_{(l)} \;\; ΔH_\ce{fus}=\mathrm{6.01\; kJ/mol} \label{10.4.9} \]
The reciprocal process, freezing, is an exothermic process whose enthalpy change is −6.0 kJ/mol at 0 °C:
\[\ce{H_2O}_{(l)} \rightarrow \ce{H_2O}_{(s)}\;\; ΔH_\ce{frz}=−ΔH_\ce{fus}=−6.01\;\mathrm{kJ/mol} \label{10.4.10} \]
Sublimation and Deposition
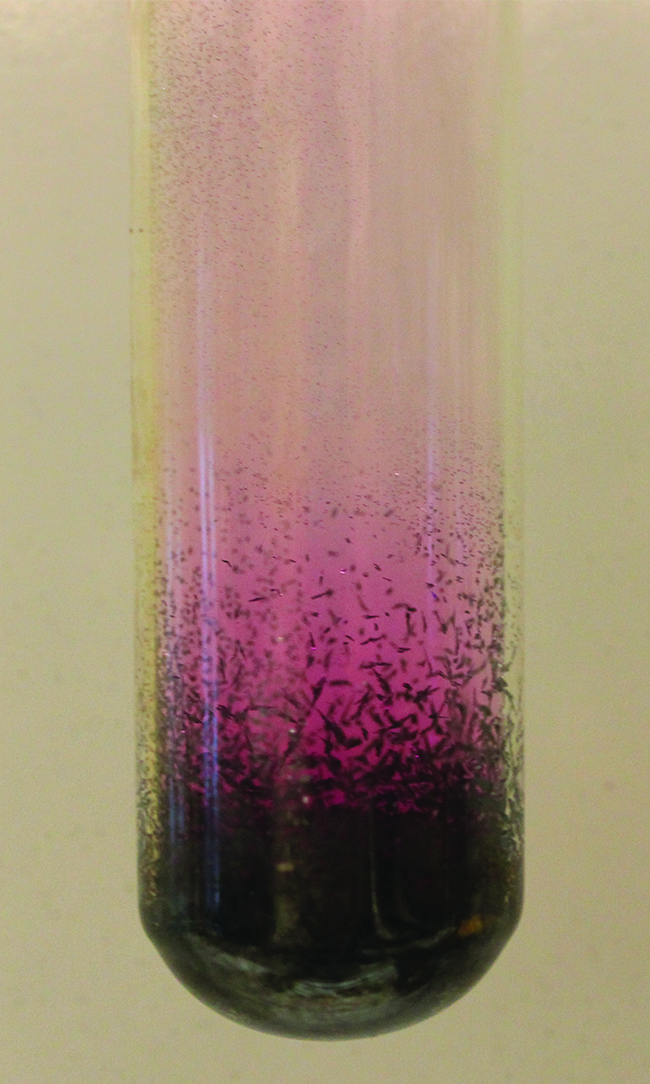
Some solids can transition directly into the gaseous state, bypassing the liquid state, via a process known as sublimation. At room temperature and standard pressure, a piece of dry ice (solid CO2) sublimes, appearing to gradually disappear without ever forming any liquid. Snow and ice sublime at temperatures below the melting point of water, a slow process that may be accelerated by winds and the reduced atmospheric pressures at high altitudes. When solid iodine is warmed, the solid sublimes and a vivid purple vapor forms (Figure \(\PageIndex{6}\)). The reverse of sublimation is called deposition, a process in which gaseous substances condense directly into the solid state, bypassing the liquid state. The formation of frost is an example of deposition.
Like vaporization, the process of sublimation requires an input of energy to overcome intermolecular attractions. The enthalpy of sublimation, ΔHsub, is the energy required to convert one mole of a substance from the solid to the gaseous state. For example, the sublimation of carbon dioxide is represented by:
\[\ce{CO2}(s)⟶\ce{CO2}(g)\hspace{20px}ΔH_\ce{sub}=\mathrm{26.1\: kJ/mol} \nonumber \]
Likewise, the enthalpy change for the reverse process of deposition is equal in magnitude but opposite in sign to that for sublimation:
\[\ce{CO2}(g)⟶\ce{CO2}(s)\hspace{20px}ΔH_\ce{dep}=−ΔH_\ce{sub}=\mathrm{−26.1\:kJ/mol} \nonumber \]
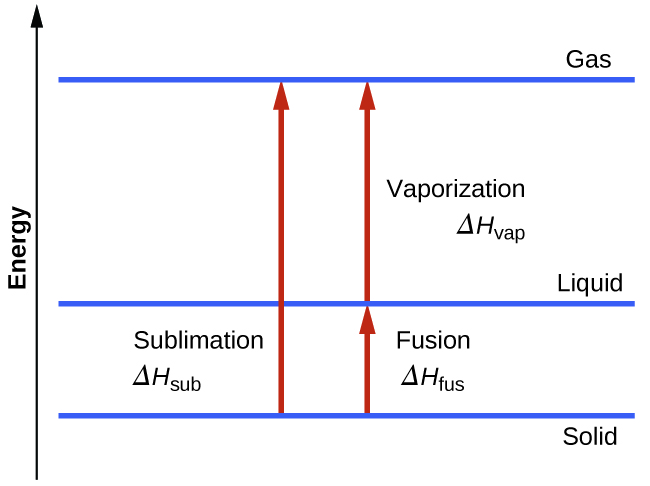
Consider the extent to which intermolecular attractions must be overcome to achieve a given phase transition. Converting a solid into a liquid requires that these attractions be only partially overcome; transition to the gaseous state requires that they be completely overcome. As a result, the enthalpy of fusion for a substance is less than its enthalpy of vaporization. This same logic can be used to derive an approximate relation between the enthalpies of all phase changes for a given substance. Though not an entirely accurate description, sublimation may be conveniently modeled as a sequential two-step process of melting followed by vaporization in order to apply Hess’s Law.
\[\mathrm{solid⟶liquid}\hspace{20px}ΔH_\ce{fus}\\\underline{\mathrm{liquid⟶gas}\hspace{20px}ΔH_\ce{vap}}\\\mathrm{solid⟶gas}\hspace{20px}ΔH_\ce{sub}=ΔH_\ce{fus}+ΔH_\ce{vap} \nonumber \]
Heating and Cooling Curves
In the chapter on thermochemistry, the relation between the amount of heat absorbed or related by a substance, q, and its accompanying temperature change, ΔT, was introduced:
\[q=mcΔT \nonumber \]
where m is the mass of the substance and c is its specific heat. The relation applies to matter being heated or cooled, but not undergoing a change in state. When a substance being heated or cooled reaches a temperature corresponding to one of its phase transitions, further gain or loss of heat is a result of diminishing or enhancing intermolecular attractions, instead of increasing or decreasing molecular kinetic energies. While a substance is undergoing a change in state, its temperature remains constant. Figure \(\PageIndex{8}\) shows a typical heating curve.
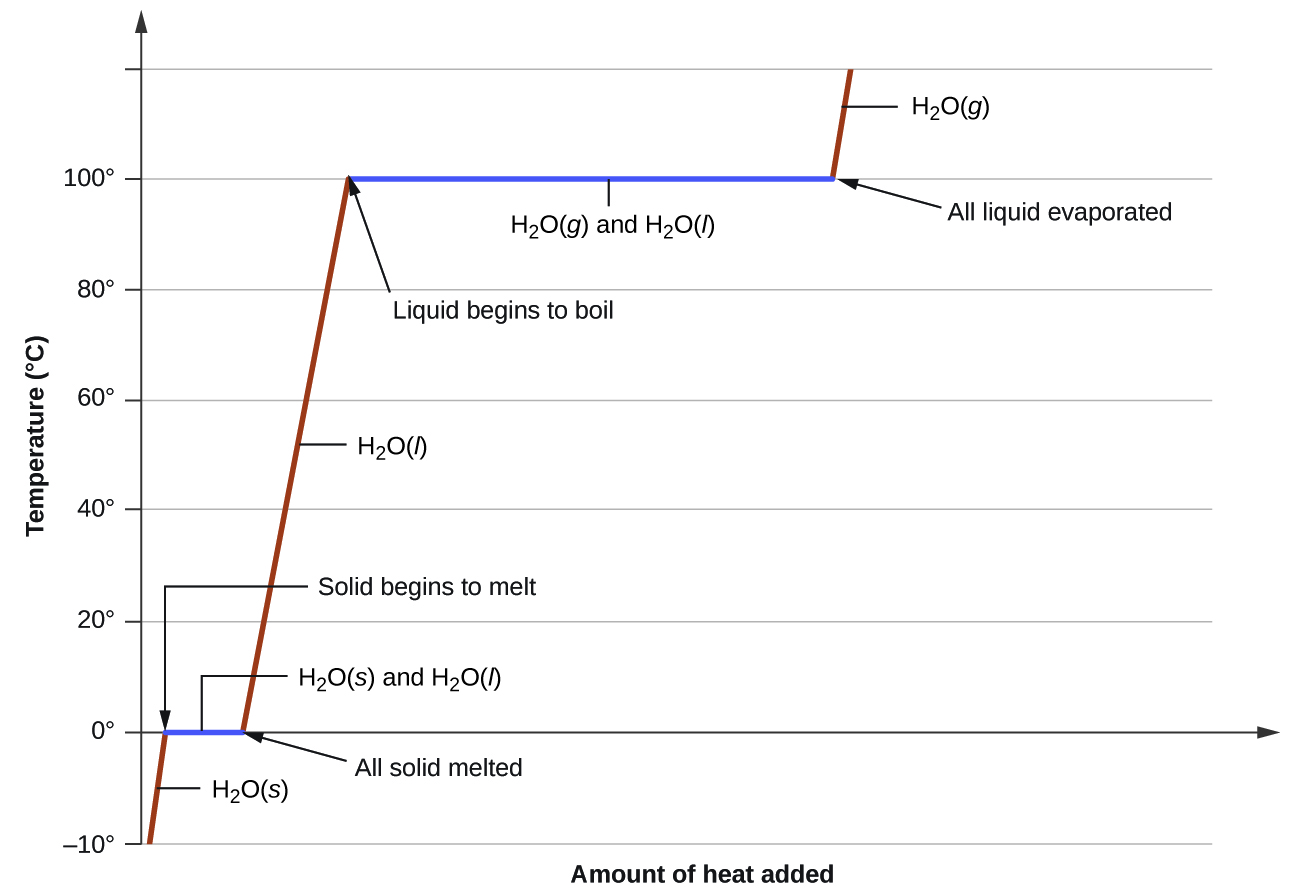
Consider the example of heating a pot of water to boiling. A stove burner will supply heat at a roughly constant rate; initially, this heat serves to increase the water’s temperature. When the water reaches its boiling point, the temperature remains constant despite the continued input of heat from the stove burner. This same temperature is maintained by the water as long as it is boiling. If the burner setting is increased to provide heat at a greater rate, the water temperature does not rise, but instead the boiling becomes more vigorous (rapid). This behavior is observed for other phase transitions as well: For example, temperature remains constant while the change of state is in progress.
How much heat is required to convert 135 g of ice at −15 °C into water vapor at 120 °C?
Solution
The transition described involves the following steps:
- Heat ice from −15 °C to 0 °C
- Melt ice
- Heat water from 0 °C to 100 °C
- Boil water
- Heat steam from 100 °C to 120 °C
The heat needed to change the temperature of a given substance (with no change in phase) is: q = m × c × ΔT (see previous chapter on thermochemistry). The heat needed to induce a given change in phase is given by q = n × ΔH.
Using these equations with the appropriate values for specific heat of ice, water, and steam, and enthalpies of fusion and vaporization, we have:
\[\begin{align*}
q_\ce{total}&=(m⋅c⋅ΔT)_\ce{ice}+n⋅ΔH_\ce{fus}+(m⋅c⋅ΔT)_\ce{water}+n⋅ΔH_\ce{vap}+(m⋅c⋅ΔT)_\ce{steam}\\[7pt]
&=\mathrm{(135\: g⋅2.09\: J/g⋅°C⋅15°C)+\left(135⋅\dfrac{1\: mol}{18.02\:g}⋅6.01\: kJ/mol
\right)}\\[7pt]
&\mathrm{+(135\: g⋅4.18\: J/g⋅°C⋅100°C)+\left(135\: g⋅\dfrac{1\: mol}{18.02\:g}⋅40.67\: kJ/mol\right)}\\[7pt]
&\mathrm{+(135\: g⋅1.84\: J/g⋅°C⋅20°C)}\\[7pt]
&=\mathrm{4230\: J+45.0\: kJ+56,500\: J+305\: kJ+4970\: J}
\end{align*} \nonumber \]
Converting the quantities in J to kJ permits them to be summed, yielding the total heat required:
\[\mathrm{=4.23\:kJ+45.0\: kJ+56.5\: kJ+305\: kJ+4.97\: kJ=416\: kJ} \nonumber \]
What is the total amount of heat released when 94.0 g water at 80.0 °C cools to form ice at −30.0 °C?
- Answer
-
40.5 kJ
Summary
Phase transitions are processes that convert matter from one physical state into another. There are six phase transitions between the three phases of matter. Melting, vaporization, and sublimation are all endothermic processes, requiring an input of heat to overcome intermolecular attractions. The reciprocal transitions of freezing, condensation, and deposition are all exothermic processes, involving heat as intermolecular attractive forces are established or strengthened. The temperatures at which phase transitions occur are determined by the relative strengths of intermolecular attractions and are, therefore, dependent on the chemical identity of the substance.
Key Equations
- \(P=Ae^{−ΔH_\ce{vap}/RT}\)
- \(\ln P=−\dfrac{ΔH_\ce{vap}}{RT}+\ln A\)
- \(\ln\left(\dfrac{P_2}{P_1}\right)=\dfrac{ΔH_\ce{vap}}{R}\left(\dfrac{1}{T_1}−\dfrac{1}{T_2}\right)\)
Glossary
- boiling point
- temperature at which the vapor pressure of a liquid equals the pressure of the gas above it
- Clausius-Clapeyron equation
- mathematical relationship between the temperature, vapor pressure, and enthalpy of vaporization for a substance
- condensation
- change from a gaseous to a liquid state
- deposition
- change from a gaseous state directly to a solid state
- dynamic equilibrium
- state of a system in which reciprocal processes are occurring at equal rates
- freezing
- change from a liquid state to a solid state
- freezing point
- temperature at which the solid and liquid phases of a substance are in equilibrium; see also melting point
- melting
- change from a solid state to a liquid state
- melting point
- temperature at which the solid and liquid phases of a substance are in equilibrium; see also freezing point
- normal boiling point
- temperature at which a liquid’s vapor pressure equals 1 atm (760 torr)
- sublimation
- change from solid state directly to gaseous state
- vapor pressure
- (also, equilibrium vapor pressure) pressure exerted by a vapor in equilibrium with a solid or a liquid at a given temperature
- vaporization
- change from liquid state to gaseous state